Download
1 / 44
440 likes | 542 Vues
ACVT-GBMCD subgroup GOMOS ozone profiles, analysis of comparison with GMBCD datasets (bright/dark, star magnitude, star temperature). Yasjka Meijer, RIVM yasjka.meijer@rivm.nl. Validation Team O 3 profiles. Validation team PI-name Institute Instrument AO 153 S. Pal SAAI/MSC Lidar

E N D
ACVT-GBMCD subgroup GOMOS ozone profiles, analysis of comparison with GMBCD datasets (bright/dark, star magnitude, star temperature) Yasjka Meijer, RIVM yasjka.meijer@rivm.nl
Validation Team O3 profiles Validation team PI-name Institute Instrument • AO 153 S. Pal SAAI/MSC Lidar • AO 158 J.-C. Lambert BIRA Microwave/lidar/sondes • AO 179 A. Matthews NIWA Microwave/sondes • AO 191 T. Blumenstock INTA FTIR • AO 300 D. De Muer RMI Sondes • AO 360 P. Keckhut CNRS Lidar • AO 429 E. Kyro FMI Sondes • AO 1103 A. Petritoli ISAC Sondes • AO 9003 D. Swart RIVM Lidar
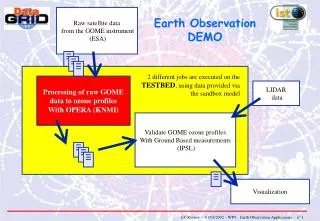
Intercomparison of Ozone Profiles GOMOS data: • from ACRI prototype processor • added solar zenith angle at tangent point GBMCD data: • collocations provided by AO-teams • all files available from NILU database • all data converted to ozone number density vs altitude Geolocation criteria: • lidar (< 24 hrs, 1000 km) • sonde (< 24 hrs, 1000 km) • microwave radiometer (< 4 hrs, 1000 km)
Geolocation of GOMOS & GBMCD data • Total collocated GOMOS-GBMCD • paired profiles: 226 • no altitude overlap: - 13 • missing files GOMOS: - 82 • available for analysis 131
Example 1 Lauder lidar
Example 2 Toronto lidar
Example 3 Uccle sonde
Important GOMOS parameters Sun position (SZA) • dark (110o-180o) • twilight (90o-110o) • bright (0o-90o) Star magnitude (MV) • strong (-2 to 1) • weak (1 to 5) Star temperature (K) • hot (7,000-100,000) • cold (1,000-7,000) More straylight Less signal from weaker stars Less UV in colder stars
LIDAR measurements vs GOMOS
Lidar All data N = 57
Lidar BRIGHT N = 4
Lidar TWILIGHT N = 13
Lidar DARK N = 40
Lidar DARK STRONG N = 5
Lidar DARK weak N = 35
Lidar DARK COLD N = 19
Lidar DARK HOT N = 21
Conclusions vs LIDAR: • bright limb ozone profiles: poor results • twilight limb ozone profiles: better than bright limb, but still large deviations (cause to be determined) • dark limb ozone profiles: good results • no systematic biases between 18-45 km • no clear influence of star magnitude or temperature
SONDE measurements vs GOMOS
Sonde All data N = 39
Sonde BRIGHT N = 26
Sonde DARK N = 13
Sonde Only 1 strong STAR (of 13), with MV<1
Sonde DARK COLD N = 9
Sonde DARK HOT N = 4
Conclusions vs SONDE: • bright limb ozone profiles: poor results • twilight limb ozone profiles: no cases • dark limb ozone profiles: good results • small systematic bias of 5-10% between 18-35 km (GOMOS lower) • star magnitude: no info • star temperature: below 22 km cold better than hot and above vice versa(?, more statistics needed)
MICROWAVE measurements vs GOMOS
Microwave Note: lower mesosphere included All data N = 35
Microwave BRIGHT N = 23
Microwave DARK N = 12
Microwave NO strong STARS, with MV<1
Microwave DARK COLD N = 4
Microwave DARK HOT N = 8
Conclusions vs MICROWAVE: • bright limb ozone profiles: poor results • twilight limb ozone profiles: no cases • dark limb ozone profiles: • (all stars) 20-45 km bias within 20% • (cold stars) 45-65 km : poor results • (hot stars) 45-65 km bias within 20% • (hot stars) 45-65 km significant non-random bias suggests possibility for improvement • star magnitude: no info
All instruments compared to GOMOS
All instruments All data N = 131
All instruments BRIGHT N = 53
All instruments BRIGHT STRONG N = 9
All instruments DARK N = 65
All instruments DARK STRONG N = 6
All instruments DARK weak N = 59
All instruments DARK COLD N = 32
All instruments DARK HOT N = 33
Conclusions vs all GBMCD instruments: • bright limb ozone profiles: • only for bright (MV<1) stars and only above 30 km • GOMOS lower by 10 to 15% (30-50 km) • twilight limb ozone profiles: • needs further research • dark limb ozone profiles: • star magnitude: no clear influence • below 18 km: poor results • 18-45 km: bias 5 to 10% (all stars) • 45-65 km : cold stars: poor results • hot stars: bias within 20%, significant non-random bias suggests possibility for improvement