Download
1 / 56
560 likes | 639 Vues
Community Profile 2010 economic Indicators of the bartlesville regional united way area Demographics. Prepared by the Community Service Council December 2010. Bartlesville regional united way area. Demographic Trends Human Investment Industry Economics and Employment Homelessness

E N D
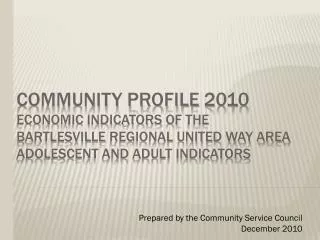
Community Profile 2010economic Indicators of the bartlesville regional united way areaDemographics Prepared by the Community Service Council December 2010
Bartlesville regional united way area • Demographic Trends • Human Investment Industry • Economics and Employment • Homelessness • Transportation • Child Indicators Prepared by the Community Service Council of Greater Tulsa
DEMOGRAPHICS Prepared by the Community Service Council of Greater Tulsa
Demographic Trends DEMOGRAPHICS Population change – out-migration of 35-50 years old Age--aging population Race and ethnicity – more culturally diverse Living arrangements – poor with growing instability Transportation – multi-county travel pattern Prepared by the Community Service Council of Greater Tulsa
Total Population Percent ChangeUS Compared to Oklahoma by Single Year of Age 0-85+ Oklahoma Ages 34-47 decline DEMOGRAPHICS Source: US Census Bureau, Population EstimatesDivision. Prepared by the Community Service Council of Greater Tulsa
DEMOGRAPHICS Prepared by the Community Service Council of Greater Tulsa
DEMOGRAPHICS Prepared by the Community Service Council of Greater Tulsa
DEMOGRAPHICS Prepared by the Community Service Council of Greater Tulsa
Demographics Prepared by the Community Service Council of Greater Tulsa
DEMOGRAPHICS Prepared by the Community Service Council of Greater Tulsa
DEMOGRAPHICS Prepared by the Community Service Council of Greater Tulsa
DEMOGRAPHICS Prepared by the Community Service Council of Greater Tulsa
DEMOGRAPHICS Prepared by the Community Service Council of Greater Tulsa
DEMOGRAPHICS Prepared by the Community Service Council of Greater Tulsa
DEMOGRAPHICS Prepared by the Community Service Council of Greater Tulsa
DEMOGRAPHICS Prepared by the Community Service Council of Greater Tulsa
DEMOGRAPHICS Prepared by the Community Service Council of Greater Tulsa
DEMOGRAPHICS Prepared by the Community Service Council of Greater Tulsa
DEMOGRAPHICS Prepared by the Community Service Council of Greater Tulsa
DEMOGRAPHICS Prepared by the Community Service Council of Greater Tulsa
DEMOGRAPHICS Prepared by the Community Service Council of Greater Tulsa
DEMOGRAPHICS Prepared by the Community Service Council of Greater Tulsa
DEMOGRAPHICS Prepared by the Community Service Council of Greater Tulsa
DEMOGRAPHICS Prepared by the Community Service Council of Greater Tulsa
DEMOGRAPHICS Prepared by the Community Service Council of Greater Tulsa
DEMOGRAPHICS Prepared by the Community Service Council of Greater Tulsa
DEMOGRAPHICS Prepared by the Community Service Council of Greater Tulsa
DEMOGRAPHICS Prepared by the Community Service Council of Greater Tulsa
DEMOGRAPHICS Prepared by the Community Service Council of Greater Tulsa
DEMOGRAPHICS Prepared by the Community Service Council of Greater Tulsa
DEMOGRAPHICS Prepared by the Community Service Council of Greater Tulsa
DEMOGRAPHICS Prepared by the Community Service Council of Greater Tulsa
DEMOGRAPHICS Prepared by the Community Service Council of Greater Tulsa
DEMOGRAPHICS Prepared by the Community Service Council of Greater Tulsa
DEMOGRAPHICS Prepared by the Community Service Council of Greater Tulsa
DEMOGRAPHICS Prepared by the Community Service Council of Greater Tulsa
DEMOGRAPHICS Prepared by the Community Service Council of Greater Tulsa
DEMOGRAPHICS Prepared by the Community Service Council of Greater Tulsa
DEMOGRAPHICS Prepared by the Community Service Council of Greater Tulsa
DEMOGRAPHICS Prepared by the Community Service Council of Greater Tulsa
DEMOGRAPHICS Prepared by the Community Service Council of Greater Tulsa
DEMOGRAPHICS Prepared by the Community Service Council of Greater Tulsa
DEMOGRAPHICS Prepared by the Community Service Council of Greater Tulsa
DEMOGRAPHICS Prepared by the Community Service Council of Greater Tulsa
DEMOGRAPHICS Prepared by the Community Service Council of Greater Tulsa
Subfamilies, by typeBRUW Counties combined, washington county, and bartlesville, 2005-09 An estimated 2-3% of families in the BRUW service area are “subfamilies,“ accounting for over 1,200 families. The majority of these subfamilies are single parent mothers with children. Source: US Census Bureau, 2005-09 American Community Survey. Prepared by the Community Service Council of Greater Tulsa
Subfamilies, by typeNowata, osage and rogers counties, 2005-09 Source: US Census Bureau, 2005-09 American Community Survey. Prepared by the Community Service Council of Greater Tulsa
DEMOGRAPHICS Prepared by the Community Service Council of Greater Tulsa
DEMOGRAPHICS Prepared by the Community Service Council of Greater Tulsa