Download
1 / 5
50 likes | 59 Vues
Fluoroquinolones are an essential class of antibacterial, and widely used in clinical application. This article concerns the spectroscopic and theoretical investigation of Ofloxacin. The experiment results were performed with Infra-Red (IR) spectroscopy, Ultra-Violet (UV) visible spectroscopy and Nuclear Magnetic Resonance (NMR) spectroscopy. Theoretical calculations were performed with Gaussian 09W and Gauss View 5 software Packages. The structure, conformational stability, geometry optimization and vibrational frequencies of Ofloxacin (OFL) have been investigated using density functional theory DFT-B3LYP methods with the 6-31 G(d,p) basis set. The Mulliken atomic charges of the title molecule were also performed using the DFT method. The presented spectroscopic investigation on OFL shows the good agreement between observed spectra and theoretical predictions of the drug. In IR spectra, the difference in intensities is seen may be due the intramolecular Hbonding in experimental study. In the experimental and theoretical studies of UV absorption energy of OFL are almost similar. For the Proton Nuclear Magnetic Resonance (1H-NMR) observed and theoretical predicted spectra are shown as the same results.

E N D
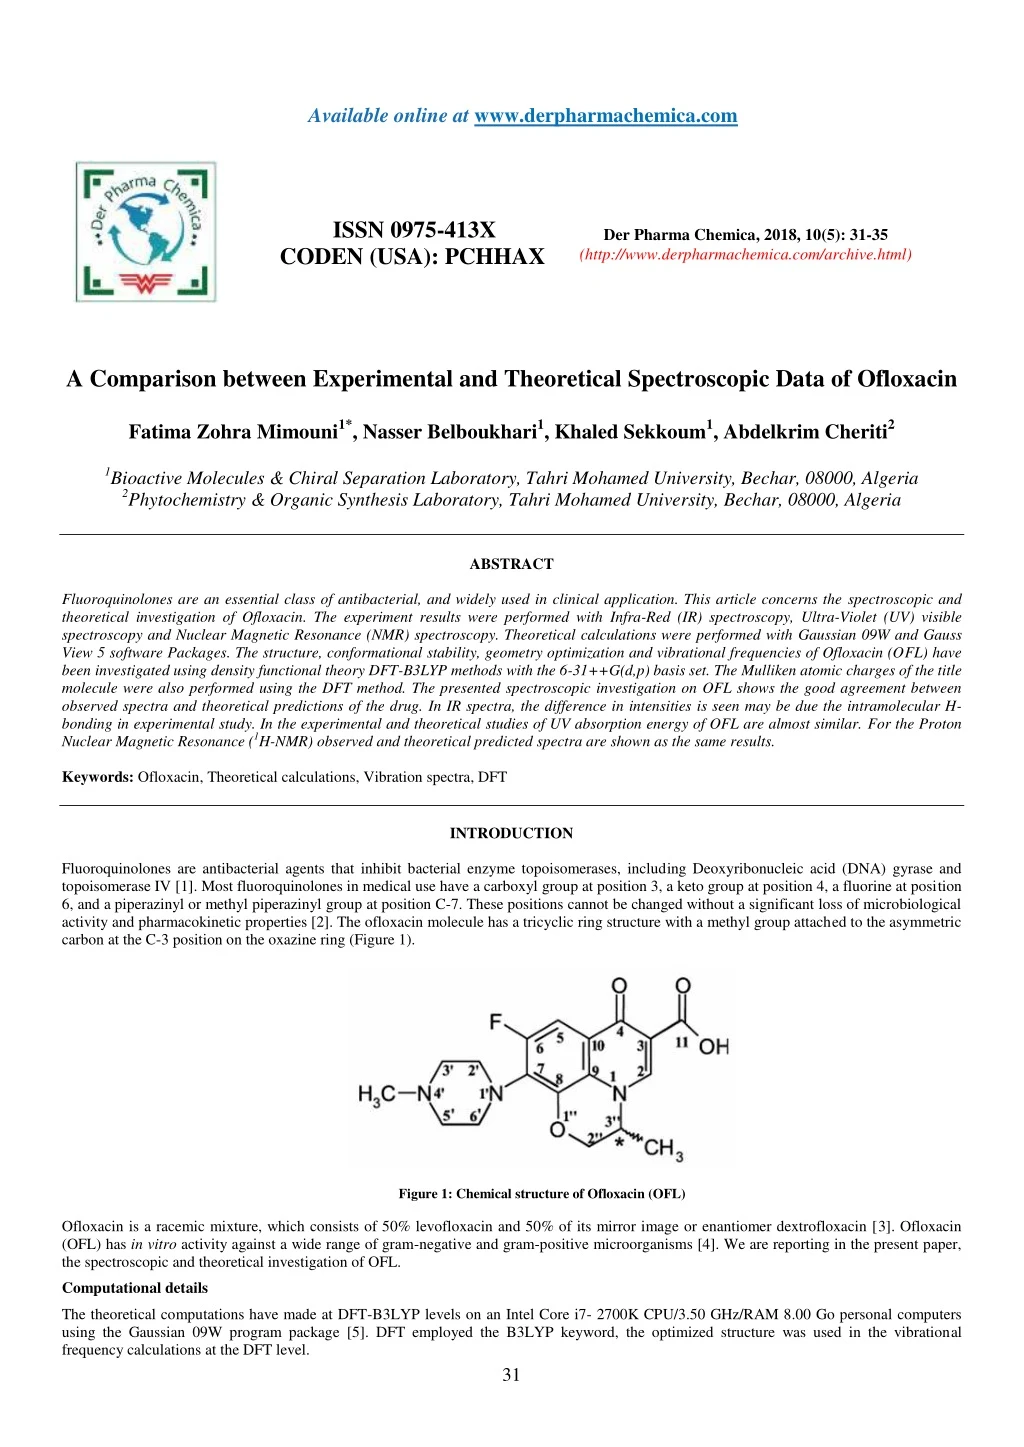
Available online at www.derpharmachemica.com ISSN 0975-413X CODEN (USA): PCHHAX Der Pharma Chemica, 2018, 10(5): 31-35 (http://www.derpharmachemica.com/archive.html) A Comparison between Experimental and Theoretical Spectroscopic Data of Ofloxacin Fatima Zohra Mimouni1*, Nasser Belboukhari1, Khaled Sekkoum1, Abdelkrim Cheriti2 1Bioactive Molecules & Chiral Separation Laboratory, Tahri Mohamed University, Bechar, 08000, Algeria 2Phytochemistry & Organic Synthesis Laboratory, Tahri Mohamed University, Bechar, 08000, Algeria ABSTRACT Fluoroquinolones are an essential class of antibacterial, and widely used in clinical application. This article concerns the spectroscopic and theoretical investigation of Ofloxacin. The experiment results were performed with Infra-Red (IR) spectroscopy, Ultra-Violet (UV) visible spectroscopy and Nuclear Magnetic Resonance (NMR) spectroscopy. Theoretical calculations were performed with Gaussian 09W and Gauss View 5 software Packages. The structure, conformational stability, geometry optimization and vibrational frequencies of Ofloxacin (OFL) have been investigated using density functional theory DFT-B3LYP methods with the 6-31++G(d,p) basis set. The Mulliken atomic charges of the title molecule were also performed using the DFT method. The presented spectroscopic investigation on OFL shows the good agreement between observed spectra and theoretical predictions of the drug. In IR spectra, the difference in intensities is seen may be due the intramolecular H- bonding in experimental study. In the experimental and theoretical studies of UV absorption energy of OFL are almost similar. For the Proton Nuclear Magnetic Resonance (1H-NMR) observed and theoretical predicted spectra are shown as the same results. Keywords: Ofloxacin, Theoretical calculations, Vibration spectra, DFT INTRODUCTION Fluoroquinolones are antibacterial agents that inhibit bacterial enzyme topoisomerases, including Deoxyribonucleic acid (DNA) gyrase and topoisomerase IV [1]. Most fluoroquinolones in medical use have a carboxyl group at position 3, a keto group at position 4, a fluorine at position 6, and a piperazinyl or methyl piperazinyl group at position C-7. These positions cannot be changed without a significant loss of microbiological activity and pharmacokinetic properties [2]. The ofloxacin molecule has a tricyclic ring structure with a methyl group attached to the asymmetric carbon at the C-3 position on the oxazine ring (Figure 1). Figure 1: Chemical structure of Ofloxacin (OFL) Ofloxacin is a racemic mixture, which consists of 50% levofloxacin and 50% of its mirror image or enantiomer dextrofloxacin [3]. Ofloxacin (OFL) has in vitro activity against a wide range of gram-negative and gram-positive microorganisms [4]. We are reporting in the present paper, the spectroscopic and theoretical investigation of OFL. Computational details The theoretical computations have made at DFT-B3LYP levels on an Intel Core i7- 2700K CPU/3.50 GHz/RAM 8.00 Go personal computers using the Gaussian 09W program package [5]. DFT employed the B3LYP keyword, the optimized structure was used in the vibrational frequency calculations at the DFT level. 31
Der Pharma Chemica, 2018, 10(5): 31-35 Fatima Zohra Mimouni et al. RESULTS AND DISCUSSIONS Molecular geometry The parameters of optimized structure was calculated by DFT-B3LYP level with the 6- 31++G(d,p) basis set in accordance with the atom numbering scheme as given in Figure 2 are listed in Table 1, the piperazine ring shows chair configuration. The benzene ring is in plane with the ring includes of N17, C1, C4 and carbonyl groups. C2, N17, C28, C25, O30, and C6 ring is distorted; C28 and C25 atoms are out of plane due to methyl group. A hydrogen bond of 2.2444 Å is formed between O11 and H13. Figure 2: Optimized structure of Ofloxacin by DFT-B3LYP/6-31++G (d,p) The dipole moment of the free OFL molecule is 09.5433 Debye, and it increases in Methanol to 13.4495 Debye, Figure 3 displays the HOMO and LUMO, both of which show π-character. LUMO are localized on benzene ring, carbonyl group, N17 and C1 atoms, whereas HOMO are localized on heterocyclic ring, C3,C6,C16,C8 of benzene ring and O30 atom. Figure 3: The Molecular orbitals of ofloxacin: a) LUMO and b) HOMO According to the calculation, both energies are negative; the difference between them is a gap energy. Depending on the accuracy of the method and the basis set, we have LUMO energy is -0.05331 eV and HOMO energy is -0.21098 eV, then gaps energy is 0.15767 eV, a large HOMO- LUMO gap indicates high stability for the molecule with respecting the additional chemical reactions [6]. Mulliken atomic charges The calculation of effective atomic charges plays an important role in the application of quantum mechanical calculations to molecular systems. Our interest here to describe the electron distribution in OFL as broadly as possible, and to assess the sensitivity of the calculated charges to change the choice of quantum chemical method. The calculated natural atomic charge values from the Mullikenpopulation analysis (MPA) procedures using the B3LYP/6-31++G (d,p) method are listed in Table 1. Table 1: Mulliken atomic charges of Ofloxacin Atom Charge Atom Charge Atom Charge Atom Charge C1 0.274 H13 0.25 C25 0.018 H37 0.115 C2 0.353 C14 0.389 H26 0.124 C38 -0.048 C3 -0.252 O15 -0.307 H27 0.124 H39 0.104 C4 0.389 C16 0.101 C28 -0.049 H40 0.13 H5 0.144 N17 -0.521 H29 0.154 C41 -0.069 C6 0.13 F18 -0.234 O30 -0.364 H42 0.097 C7 -0.059 N19 -0.488 C31 -0.321 H43 0.107 C8 0.278 N20 -0.382 H32 0.136 C44 -0.067 H9 0.12 C21 -0.168 H33 0.126 H45 0.105 C10 0.419 H22 0.109 H34 0.136 H46 0.089 32
Der Pharma Chemica, 2018, 10(5): 31-35 Fatima Zohra Mimouni et al. O11 -0.301 H23 0.108 C35 -0.01 / / O12 -0.376 H24 0.083 H36 0.115 / / The MPA of OFL shows that the presence of two oxygen’s atoms (O11=-0.301; O12=- 0.376) imposes positive charges on the carbon atom (C10=0.419). Moreover, there is no difference in charge distribution observed on all hydrogen atoms except on H13 hydrogen atom. The large positive charge on H13 is due to the large negative charge accumulated on the O12 atom. IR Spectral Studies In the experimental analysis, IR spectra were recorded on Fourier Transform Infrared Spectroscopy (FTIR) 460 PLUS (KBr discs) in the range from 4000-400 cm−1 [7], the compound was in solid crystalline state and in theoretical spectrum the molecule was isolated in the gas phase. The experimental and theoretical spectra of OFL are shown in Figure 4 [8]. Figure 4: Observed and theoretical predicted IR spectra of Ofloxacin The band region from 3500 to 4000 cm-1 is assigned to carboxylic acid O-H stretch in both spectra. The difference in intensities is seen may be due the intra molecular H-bonding in experimental spectrum. The bond region from 1400 to 1800 is comparable in both spectra. The band region from 1650 to 1800 cm-1 is assigned to carboxylic acid C=O stretch and 1500 to 1650 cm-1 keto C=O stretch in both spectra. UV-vis Spectral Studies Electronic spectra were obtained using UV-3101PC Shimadzu [9]. The observed and theoretical spectra of ofloxacin in an organic solvent (methanol) are shown in Figure 5. The experimental UV-vis spectra of OFL have two types of absorption bands at λmax 220 nm and 312, 340 nm, and is almost similar spectrum of OFL was observed in the methanol from literature [10] which can be assigned to π-π* and n-π* transitions within the organic molecule. While the UV-vis spectra of theoretical one have two bands at λmax 220 nm and 410 nm respectively. The above discussion shows the good agreement between observed and theoretical predications. 33
Der Pharma Chemica, 2018, 10(5): 31-35 Fatima Zohra Mimouni et al. Figure 5: Observed and theoretical predicted UV-vis spectra of Ofloxacin 1H-NMR Spectral Studies Proton and carbon NMR spectra were recorded on Bruker DPX-300 (300 MHz); Bruker DRX-400 (400 MHz) and Bruker DRX- 500 (500 MHz) spectrometers [11]. Figure 6: a) 1H-NMR observed spectra of ofloxacin b) NMR theoretical predicted spectra of Ofloxacin 34
Der Pharma Chemica, 2018, 10(5): 31-35 Fatima Zohra Mimouni et al. The spectra of OFL (Figure 6) show two aromatic resonances around 7-8.5 ppm, the oxazine resonances at 4-5 ppm, the piperazine resonances at 2.5-4 ppm, and at approximately 1.5 ppm the oxazine methyl resonance. The proton assignment was checked by 2D 1H-13C Heteronuclear Single-Quantum Correlation (HSQC) and Heteronuclear Multiple Bond Correlation (HMBC) experiments and it is in agreement with previous works [12-14]. Still, it was not possible to separate between H2′′a and H2′′b (Figure 1). CONCLUSION The presented spectroscopic investigations on OFL have given good results on their electronic and vibrational structure. The observed infrared electronic spectra of Ofloxacin have given good agreement to theoretical predictions performed with Density Functional Theory, using the B3LYP functional and the 6-31G* basis set (B3LYP/6-31G*). The UV- Vis absorption spectra of drug was in recorded in organic solvent (methanol) and theoretical calculation predictions were performed in Density Functional Theory, using the B3LYP functional and the 6-31G* basis set (B3LYP/6-31G*) –PCM methanol. The λmax of the drug located at 300 nm and 296 nm in both the observed and theoretical spectra. This shows the good agreement between observed spectra and theoretical predictions of the drug. REFERENCES [1] P.M. Bennett, Brit. J. Pharmacol. 2008, 153(1), 347-357. [2] L.A. Mitscher, P. Devasthale, R. Zavod, Quinolone Antimicrobial Agents, American Society for Microbiology, 2nd Edi., Washington DC, 1993, 3-53. [3] B. Chen, Y. Zhang, H.L. Xie, Q.M. Chen, Q.H. Mai, J. Chin. Chem. Soc., 2014, 61(4), 432-436. [4] A. Ahmed, M. Daneshtalab, J.Pharm. Pharmaceut. Sci., 2012, 15(1), 52-72. [5] Gaussian 09W Reference, www.gaussian.com/g_tech/g_ur/l_keywords09.html [6] Z. Zhou, R.G. Parr, J. Am. Chem. Soc., 1990, 112(15), 5720-5724. [7] S.A. Sadeek, W.A. Zordok, W.H. El-Shwiniy, J.Korean. Chem. Soc.,2013, 57(5), 574-590. [8] S. Sagdinc, S. Bayari, J. Theo. Chem., 2004, 668(2–3), 93-99. [9] Ferguson, J.Photochem. Photobiol., 1995, 62(6), 954-958. [10] D.M. Hercules, J. Chem. Educ., 1969, 46(6), A449. [11] M.S. Arayne, N. Sultana, U. Haroon, M.H. Zuberi, S.B. Shakeb, Arch. Pharm. Res., 2010, 33(12), 1901-1909. [12] T. Skauge, I. Turel, E. Sletten, Inorg. Chim. Acta.,2002, 339(1), 239-247. [13] M. Sakai, H. Hara, S. Anjo, M. Nakamura, J. Pharm. Biomed. Anal.,1999, 18(6), 1057-1067. [14] A. Mucci, L. Malmusi, M.A. Vandelli, M. Fresta, L. Schenetti, Med. Res. Chem.,1996, 6(5), 353-363. 35