Download
1 / 7
70 likes | 73 Vues
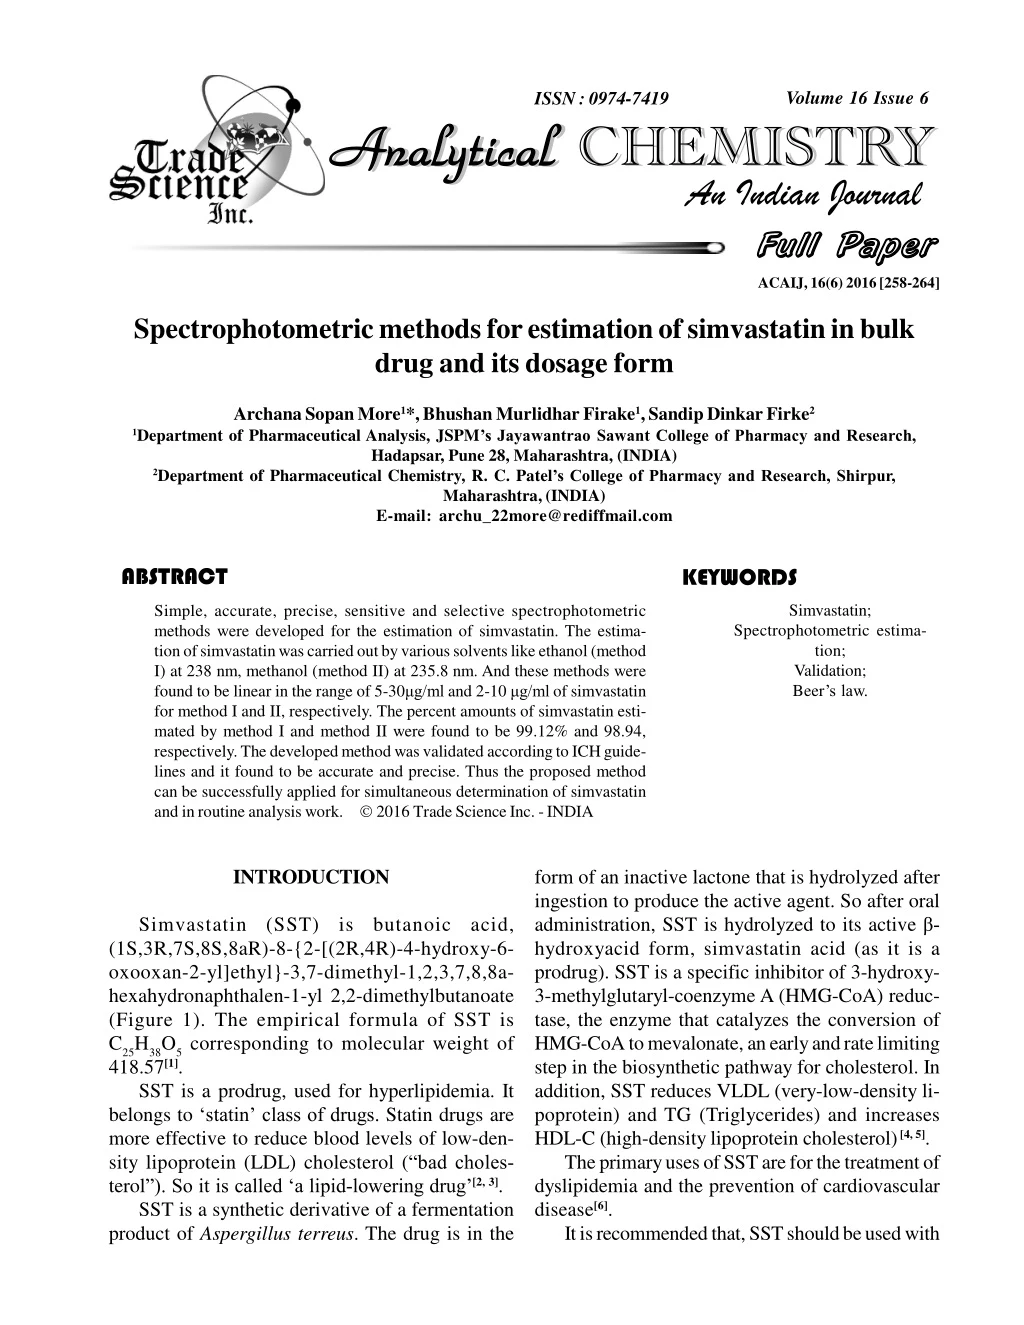
Simple, accurate, precise, sensitive and selective spectrophotometric methods were developed for the estimation of simvastatin. The estimation ofsimvastatin was carried out by varioussolventslike ethanol (method I) at 238 nm, methanol (method II) at 235.8 nm. And these methods were found to be linear in the range of 5-30u00cfg/ml and 2-10 u00cfg/ml of simvastatin for method I and II, respectively. The percent amounts of simvastatin esti- mated by method I and method II were found to be 99.12% and 98.94, respectively. The developed method was validated according to ICH guidelines and it found to be accurate and precise.

E N D
id7072921 pdfMachine by Broadgun Software - a great PDF writer! - a great PDF creator! - http://www.pdfmachine.com http://www.broadgun.com Volume 16 Issue 6 ISSN : 0974-7419 Analytical Analytical CHEMISTRY Analytical Analytical CHEMISTRY An Indian Journal Full Paper Full Paper ACAIJ, 16(6) 2016 [258-264] Spectrophotometric methods for estimation of simvastatin in bulk drug and its dosage form Archana Sopan More1*, Bhushan Murlidhar Firake1, Sandip Dinkar Firke2 1Department of Pharmaceutical Analysis, JSPM’s Jayawantrao Sawant College of Pharmacy and Research, Hadapsar, Pune 28, Maharashtra, (INDIA) 2Department of Pharmaceutical Chemistry, R. C. Patel’s College of Pharmacy and Research, Shirpur, Maharashtra, (INDIA) E-mail: archu_22more@rediffmail.com ABSTRACT KEYWORDS Simvastatin; Simple, accurate, precise, sensitive and selective spectrophotometric methods were developed for the estimation of simvastatin. The estima- tion of simvastatin was carried out by various solvents like ethanol (method I) at 238 nm, methanol (method II) at 235.8 nm. And these methods were found to be linear in the range of 5-30ìg/ml and 2-10 ìg/ml of simvastatin for method I and II, respectively. The percent amounts of simvastatin esti- mated by method I and method II were found to be 99.12% and 98.94, respectively. The developed method was validated according to ICH guide- lines and it found to be accurate and precise. Thus the proposed method can be successfully applied for simultaneous determination of simvastatin and in routine analysis work. 2016 Trade Science Inc. - INDIA Spectrophotometric estima- tion; Validation; Beer’s law. INTRODUCTION form of an inactive lactone that is hydrolyzed after ingestion to produce the active agent. So after oral administration, SST is hydrolyzed to its active â- hydroxyacid form, simvastatin acid (as it is a prodrug). SST is a specific inhibitor of 3-hydroxy- 3-methylglutaryl-coenzyme A (HMG-CoA) reduc- tase, the enzyme that catalyzes the conversion of HMG-CoA to mevalonate, an early and rate limiting step in the biosynthetic pathway for cholesterol. In addition, SST reduces VLDL (very-low-density li- poprotein) and TG (Triglycerides) and increases HDL-C (high-density lipoprotein cholesterol) [4, 5]. The primary uses of SST are for the treatment of dyslipidemia and the prevention of cardiovascular disease[6]. It is recommended that, SST should be used with Simvastatin (SST) is butanoic acid, (1S,3R,7S,8S,8aR)-8-{2-[(2R,4R)-4-hydroxy-6- oxooxan-2-yl]ethyl}-3,7-dimethyl-1,2,3,7,8,8a- hexahydronaphthalen-1-yl 2,2-dimethylbutanoate (Figure 1). The empirical formula of SST is C25H38O5 corresponding to molecular weight of 418.57[1]. SST is a prodrug, used for hyperlipidemia. It belongs to ‘statin’ class of drugs.Statin drugs are more effective to reduce blood levels of low-den- sity lipoprotein (LDL) cholesterol (“bad choles- terol”). So it is called ‘a lipid-lowering drug’[2, 3]. SST is a synthetic derivative of a fermentation product of Aspergillus terreus. The drug is in the
ACAIJ, 16(6) 2016 Archana Sopan More et al. 259 Full Paper Full Paper mass spectrometry (GC–MS)[13], HPLC[14-19], HPTLC[20]. And there are very few UV-visible spec- trophotometric methods reported as per extensive literature survey. So a successful attempt was made to develop, validate and compare simple, precise and accurate spectrophotometric methods for the estimation of SST in bulk and its pharmaceutical formulation using etha- nol and methanol as solvents. The methods were validated according to ICH guidelines[21]. EXPERIMENTAL Figure 1 : Chemical structure of simvastatin Instrumentation A double beam UV visible spectrophotometer (UV-2450, ‘Shimadzu’, Japan) connected to com- puter loaded with spectra manager software ‘UV probe’ with 10 mm quartz cells were used. The spec- tra were obtained with the instrumental parameters as: wavelength range (200-400 nm), scan speed (me- dium), sampling interval (1 nm), spectral slit width (1 nm). A high precision analytical balance, Model-GR- 202 (AND Instrument India Pvt. Ltd., Gurgaon, In- dia) of sensitivity 0.1 mg was used to weigh samples. Materials/ Chemicals SST was obtained as a gift sample from Cipla Ltd. It was used without further purification. A tab- let formulation ‘Simcard’ of Cipla Ltd. containing 10 mg of SST was purchased from local market. All chemicals used were of analytical grade (AR grade). Preparation of standard stock solution exercise, diet, and weight-loss to control elevated cholesterol, or hypercholesterolemia[7]. The statins contain chromophoric groups in their chemical structure, which are responsible for giv- ing sharp spectra in UV-visible region. So the drug can be directly assessed by dissolving in suitable solvents using UV spectrophotometry. Therefore there is no need to derivatise the drug. SST is practically insoluble in water, and freely soluble in chloroform, methanol and ethanol. So here, ethanol and methanol are selected to dissolve the drug for further analysis. The drug is officially listed in 2004 United States Pharmacopocia and the official method of its deter- mination is high-performance liquid chromatogra- phy[8]. Several methods have been reported so far for analysis of SST by various analytical techniques. Some of them include liquid chromatography with UV detection (LC–UV)[9-11], liquid chromatography with fluorescence detection[12], gas chromatography– Figure 2 : UV overlain spectrum of SST in ethanol Analytical Analytical CHEMISTRY Analytical Analytical CHEMISTRY An Indian Journal
Spectrophotometric methods for estimation of simvastatin in bulk drug and its dosage form . 260 ACAIJ, 16(6) 2016 Full Paper Full Paper Figure 3 : UV overlain spectrum of SST in methanol Figure 4 : Calibration curve for method I For method I, an accurately weighed quantity 5 mg of SST was taken in a 50 ml volumetric flask and was dissolved in around 20 ml of ethanol, fi- nally made up the volume up to the mark with etha- nol to get the stock solution of 100 µg/ml. Suitable aliquots from this solution were taken and further diluted to obtain the working solutions using water. Same procedure had been carried out for method II using methanol as a solvent, in place of ethanol for the preparation of standard stock solution. In this case also, further dilutions were made using water. Procedure Construction of Calibration Graphs Method I: Aliquots of working standard solution of SST (prepared for Method I) were further diluted to ob- tain the concentrations in the range of 5-30 ìg/mL using water. Then the absorbance of the samples were mea- sured spectrophotometrically at 238 nm against re- spective reagent blank i.e. ethanol. The calibration graph was constructed by plotting the absorbance versus the final concentration of the drug (ìg/mL). Alternatively, the corresponding regression equation was derived (Figure 2 and 4). Method II: In the same way, aliquots of working standard solution of SST (prepared for Method II) were fur- ther diluted to obtain the concentrations in the range of 2-10 ìg/mL using water. Then the absorbance of the samples were mea- sured spectrophotometrically at 235.8 nm against respective reagent blank i.e. methanol. The calibra- tion graph was constructed by plotting the absor- bance versus the final concentration of the drug (ìg/ mL). Alternatively, the corresponding regression equation was derived (Figure 3 and 5). Analytical Analytical CHEMISTRY Analytical Analytical CHEMISTRY An Indian Journal
ACAIJ, 16(6) 2016 Archana Sopan More et al. 261 Full Paper Full Paper Figure 5: Calibration curve for method II TABLE 1 : Optical characteristics of SST Sr. No. 1. 2. 3. 4. 5. 6. 7. 8. Parameters ëmax (nm) Method I (using ethanol) 238 nm 5 – 30 ìg/mL y = 0.042x - 0.058 0.042 0.058 0.994 0.84 2.42 Method II (using methanol) 235.8 nm 2 – 10 ìg/mL y = 0.059x - 0.00027 0.059 0.027 0.996 0.48 1.66 Beer-Lambert’s range(ìg/mL) Regression Equation, y=mx+c Slope (m) Intercept (c) Correlation coefficient (r2) Limit of detection (ìg/mL) Limit of quantitation (ìg/mL) Assay procedures for tablets Twenty tablets were weighed and powdered. Average weight was determined. Powder equiva- lent to 5 mg of SST was weighed accurately and transferred to the 50 ml volumetric flask. To it, 20 ml of ethanol was added and ultrasonicated until the drug is dissolved. The solution was filtered and made up the volume up to the mark with ethanol. This so- lution was suitably diluted to obtain the required concentration. Same procedure had been followed for method II using methanol as a solvent, in place of ethanol. Validation Validation of the developed methods were done according to ICH guidelines[21]. Linearity and range The calibration graphs obtained by plotting the values of the absorbance versus the final concentra- tions (ìg/mL). A linear correlation was found be- tween the absorbance and the concentration of SST. Beer’s law was obeyed. The regression analysis of Beer’s law data using the method of least squares was made to evaluate the slope (m), the intercept (c) and the correlation coefficient (r) and the calcu- lated values are given in TABLE 1. The graphs showed maximum intercept as described by the re- gression equation, y = mx + c, where y is the absor- bance and x is the concentration in ìg/ml. Limits of detection and limits of quantitation The limit of detection (LOD) is a lowest con- centration of analyte which can be detected and limit of quantitation (LOQ) is a lowest concentration of analyte which can be quantitated. The results are summarized in TABLE 1. LOD and LOQ can be cal- culated according to the following equations LOQ = 10 Sc/m LOD = 3.3 Sc/m Where Sc is the standard deviation of the intercept of regression line, and m is the slope of the regres- Analytical Analytical CHEMISTRY Analytical Analytical CHEMISTRY An Indian Journal
Spectrophotometric methods for estimation of simvastatin in bulk drug and its dosage form . 262 ACAIJ, 16(6) 2016 Full Paper Full Paper TABLE 2: Accuracy Initial amount (ìg/mL) Method I 5 5 5 Method I Method II Sr. No. % amount of drug added Method II 20 20 20 % Recovery 99.77 98.90 101.02 % RSD 0.38 0.48 0.62 % Recovery 100.56 99.43 100.32 % RSD 0.32 0.41 0.24 1. 2. 3. 80 100 120 TABLE 3: Intraday and interday precision data for method I and II Intraday Precision Intraday ±S. D. 9.98 ± 0.09 15.01 ± 0.06 20.07 ± 0.07 2.98 ± 0.05 6.09 ± 0.14 9.11 ± 0.08 Interday Precision Interday ± S. D. 9.95 ± 0.11 14.99 ± 0.02 20.02 ± 0.14 3..23 ± 0.14 5.86 ± 0.12 8.78 ± 0.23 Methods Concentrations (ìg/mL) 10 15 20 3 6 9 C. V. 0.60 0.29 0.24 0.33 0.65 0.32 C. V. 0.73 0.10 0.35 0.91 0.60 0.92 Method I Method II sion line. Accuracy The accuracy of the proposed methods was stud- ied by calculating mean % recovery performed at three different levels i.e. 80 %, 100% and 120 %. To the pre-analyzed sample solution a known amount of SST bulk drug was added at 80 % to 120 % and the re-analyzed the SST by proposed methods. Precision Intraday and Interday precision were expressed as the S. D. and C. V. of a series of measurements by analyzing the drug concentrations of 10 ìg/mL, 15 ìg/mL and 20 ìg/mL for method I and 3 ìg/mL, 6 ìg/mL and 9 ìg/mL for method II. Specificity The specificity of the methods was investigated by observing any interference encountered from the common tablet additives. These additives did not interfere with the proposed methods. Ruggedness Ruggedness of the proposed methods was de- termined by analyzing aliquots from homogenous slot 20 ìg/mL (method I) and 6 ìg/mL (method II) by different analysts under similar operational and en- vironmental conditions. Comparison of the two developed methods The comparison of the two developed spectro- photometric methods for the determination of SST leads to the following advantages/disadvantages: Method II is more sensitive than Method I. The linearity for method I lies in 5 – 30 ìg/mL whereas that for method II in 2 – 10ìg/mL. Both methods are selective for the determina- tion of the analyte in its pharmaceutical formulations. HPLC technique also gives good results but, be- cause of the low cost and ease of carrying out the spectrophotometric methods, the proposed proce- dures are likely to be very suitable for the quality control of SST in tablet dosage form. RESULTS AND DISCUSSION In method I and II, SST followed linearity in the concentration range of 5 – 30 ìg/ mL and 2 -10 ìg/ mL, respectively. The details of optical characteris- tics are summarized in TABLE 1. The regression analysis using the method of least squares was made for the slope (b), intercept (a) and correlation coef- ficient (r)obtained from different concentrations are given in TABLE 1. LOD and LOQ were found to be 0.84 ìg/mL and 2.42 ìg/mL respectively for method I and 0.48 ìg/ mL and 1.66 ìg/mL, respectively for method II (TABLE 1). The % amount of SST estimated by method I and II was found to be 99.17 % and 98.26%, re- spectively. Results signified that there was no in- Analytical Analytical CHEMISTRY Analytical Analytical CHEMISTRY An Indian Journal
ACAIJ, 16(6) 2016 Archana Sopan More et al. 263 Full Paper Full Paper TABLE 4 : Ruggedness data for method I and II % label claim Method I 99.86 99.69 100.21 Mean ± S. D. % RSD Method II 98.89 100.81 98.98 1st analyst 2nd analyst 3rd analyst 99.38 100.25 99.59 0.68 0.79 0.87 0.69 0.79 0.87 terference from the excipients generally occurs in tablet formulation. The developed methods were validated for accu- racy, precision and ruggedness as per ICH guidelines. The accuracy methods were studied as mean % recovery and found to be in the range of 98.90- 101.02 (method I) and 99.43 -100.56 (method II), respectively (TABLE 2). The precision of the methods was determined as intra-day and inter-day study. An appropriate con- centration 10 ìg/mL, 15 ìg/mL and 20 ìg/mL in method I and 3 ìg/mL, 6 ìg/mL and 9 ìg/mL ( method II) were selected and instrumental responses were determined (TABLE 3). Ruggedness of the proposed methods was de- termined by analyzing aliquots from homogenous slot 20 ìg/mL (method I) and 6 ìg/mL (method II) by different analysts under similar operational and en- vironmental conditions. The results are reported in terms of % RSD, shown in TABLE 4. founder secretary of JSPM and Dr. V. I. Hukkeri, Principal, for providing all necessary facilities to carry the present research. Authors are also thankful to Dr. S. D. Ambavade for their kind suggestion and guidance during research. REFERENCES [1] Merck index, Maryadele J.O.Neil; Edu.In: 13th Edi- tion, Published by Merck Research Lab., NJ, USA, 868 (2001). Scrip (Firm), Simvastatin: A concise review of se- lected scientific literature on simvastatin (a Once-a- day Analogue of Lovastatin) and an Update of the Use of HMG-CoA reductase inhibitors in the treat- ment of hypercholesterolaemia issue 42 of scrip’s new product review, PJB Publica- tions, 2- 48 (1989). [3] R.R.Baliga; Oxford americal pocket notes, Statin prescribing guide, Oxford University Press, New York, 12-20 (2010). [4] B.Hephaestus; Articles on hypolipidemic agents, In- cluding: Niacin, Hypolipidemic Agent, Ezetimibe, Ezetimibe/Simvastatin, Phytosterol, Policosanol, Torcetrapib, Hephaestus Books, ISBN 1243297344, 9781243297341, 1-60 (2011). [5] F.Michael, B.Eleanor, M.Jonathan; Simvastatin: Lipid disorders drugs in context series, CSF medical communications, 9781905064458, 15-28 (2004). [6] B.H.Roberts; The truth about statins: Risks and al- ternatives to cholesterol-lowering drugs, Gallery books, A divison of simon & schuster, Inc., New York, 12-17 (2012). [7] T.R.Harrison, A.S.Fauci; Harrison’s principles of internal medicine, McGraw-Hill, 365 (2001). [8] The united state pharmacopoeia 25, The national formulary, 20, United states pharmocopocial con- vention Inc., 9571 (2002). [9] L.Wang, M.Asgharnejad; Second derivative UV spectrometric determination of simvastatin in tablet dosage form J. Pharm Biomed Anal, 21(6), 1243- [2] CONCLUSION Two simple, accurate and precise and reason- ably sensitive spectrophotometric methods were developed for the determination of SST in bulk drug and in tablets. The developed spectrophotometric methods were validated for estimation of SST using linearity, range, accuracy, precision and ruggedness. Moreover, the developed methods are less time- consuming as the methods require simple dilutions. The technique employed is inexpensive but was demonstrated to provide the sensitivity comparable to the expensive technique like HPLC. Thus, the methods are suitable for routine analysis in quality control laboratories. ISBN 1905064454, ACKNOWLEDGEMENTS The authors are thankful to Prof T. J. Sawant, Analytical Analytical CHEMISTRY Analytical Analytical CHEMISTRY An Indian Journal
Spectrophotometric methods for estimation of simvastatin in bulk drug and its dosage form . 264 ACAIJ, 16(6) 2016 Full Paper Full Paper 1248 (2000). [10] L.Tan, L.L.Yang, X.Zhang, Y.S.Yuan, S.S.Ling; Determination of simvastatin in human plasma by high performance liquid chromatography, 18(3), 232- 234 (2000). [11] G.Curlucci, P.Mazzeo, L.Biordi, M.Bologna; Simul- taneous determination of simvastatin and its hydroxy acid form in human plasma by high performance liquid chromatography with UV detection, J Pharm.Biomed.Anal. 10(9), 693-7 (1992). [12] H.Ochiai, N.Uchiyama, K.Imagaki, S.Hata, T.Kamei; Determination of simvastatin and its ac- tive metabolites in human plasma by column-switch- ing high performance liquid chromatography with fluorescence detection after derivatization with 1- bromoacetylpyrene, J Chromatogr B Biomed Sci., 694(1), 211-217 (1997). [13] M.J.Morris, J.D.Gilbert, B.K.Matuszewski, H.G.Ramjit, W.F.Bayne; Deter- mination of the HMG- CoA reductase inhibitors simvastatin, lovastatin and pravastatin in plasma by gas chromatography/chemical ionization mass spec- trometry, Biol.Mass Spectrom., 22(1), 1-8 (1993). [14] A.Ali, J.Anal.Chem., 61, 63 (2006). [15] X.Jianwei, L.Ying; Yaowu Fenxi Zazhi, 25, 523 (2005). [16] G.Carolina, G.C.Gloria, D.D.Marta, G.Ricardo; J.Chilean Chem.Soc., 49, 289 (2004). [17] G.Carlcucci, P.Mazzeo; Farmaco, 47, 817 (1992). [18] X.Xan, G.Cao, X.He, X.Hu, D.Gu; Huaxi Yaoxue Zazhi, 15, 205 (2000). [19] J.Wang; Thongguo Yiyao Gongye ZaZhi, Sci Finder, CAN 132:284323; AN 2000:293986, 31, 121 (2000). [20] B.G.Chaudhari, N.M.Patel, P.B.Shah; Determina- tion of simvastatin, Pravastatin sodium and Rosuvastatin calcium in tablet dosage forms by HPTLC, Indian J.Pharma.Sci., Feb, 69(1), 130 (2007). [21] ICH, Validation of analytical procedures: Methodol- ogy Q2 (R1), International conference on harmoni- zation, IFPMA, Geneva, (1996). E.S.M.Nameh, R.A.Shawabkeh; J.Y.Hsieh, Analytical Analytical CHEMISTRY Analytical Analytical CHEMISTRY An Indian Journal