Download
1 / 25
260 likes | 294 Vues
The present study describes the development and subsequent validation of stability-indicating methods for determination of Milnacipran HCl 'A', Duloxetine HCl 'B', and Pregabalin 'C' each in the presence of its degradation products, using highperformance thin layer chromatographic techniques (HPTLC). The chromatographic development was carried out on HPTLC plates precoated with silica gel 60 F254 using a mixture of acetonitrile-water-ammonia (6 0.6 1.6, v/v/v) as a mobile phase for A, dichloromethane-methanol (8 1, v/v) as a mobile phase for B, and ethyl acetate-methanol-ammonia (6 3 0.1, v/v/v) as a mobile phase for C.

E N D
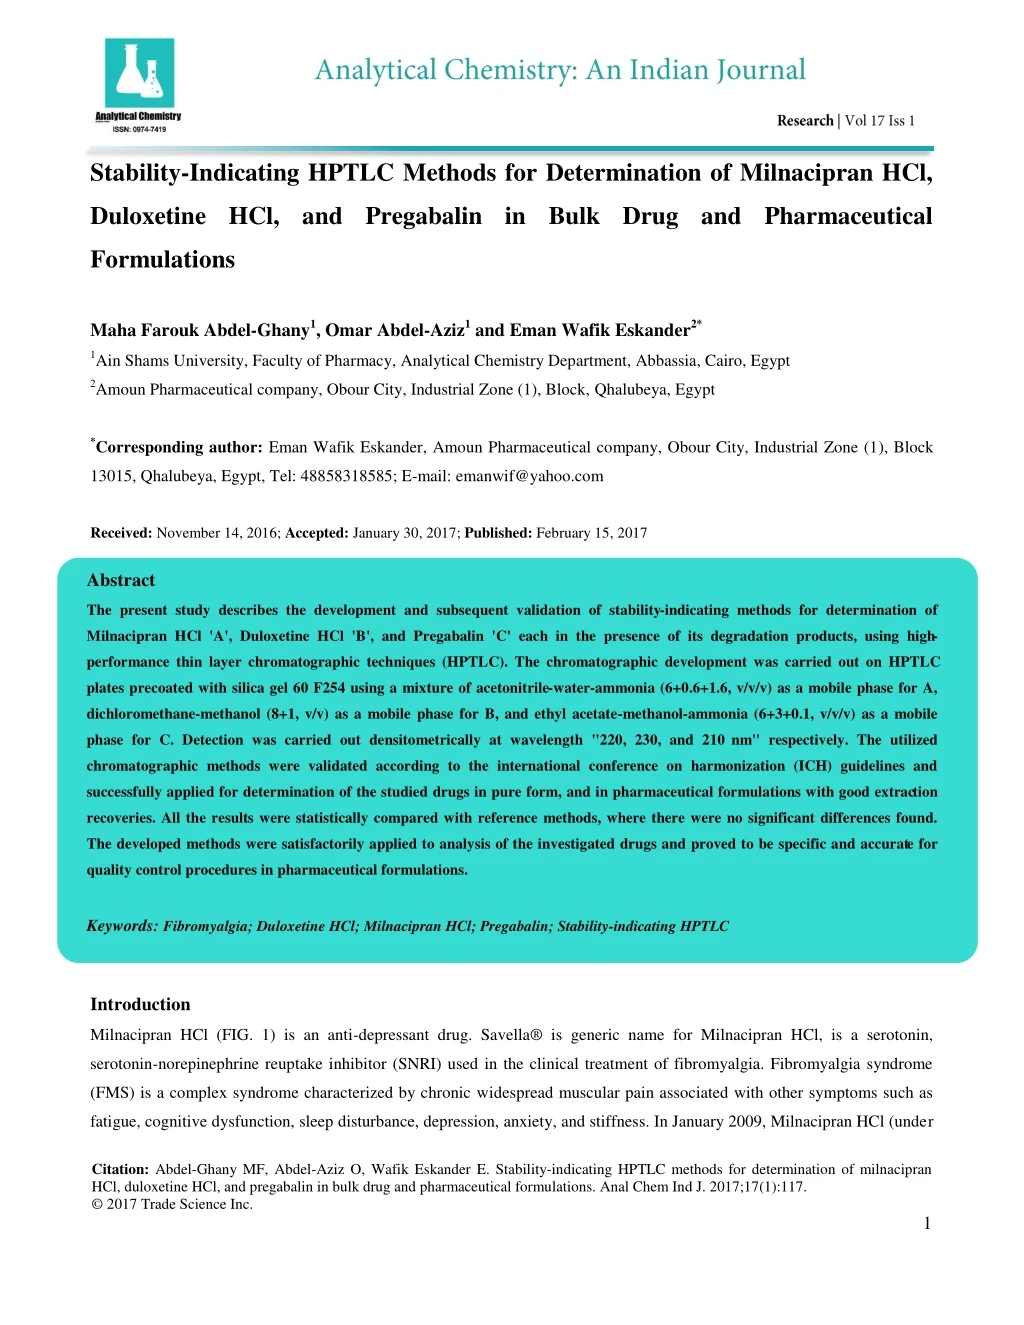
Stability-Indicating HPTLC Methods for Determination of Milnacipran HCl, Duloxetine HCl, and Pregabalin in Bulk Drug and Pharmaceutical Formulations Maha Farouk Abdel-Ghany1, Omar Abdel-Aziz1 and Eman Wafik Eskander2* 1Ain Shams University, Faculty of Pharmacy, Analytical Chemistry Department, Abbassia, Cairo, Egypt 2Amoun Pharmaceutical company, Obour City, Industrial Zone (1), Block, Qhalubeya, Egypt *Corresponding author: Eman Wafik Eskander, Amoun Pharmaceutical company, Obour City, Industrial Zone (1), Block 13015, Qhalubeya, Egypt, Tel: 48858318585; E-mail: emanwif@yahoo.com Received: November 14, 2016; Accepted: January 30, 2017; Published: February 15, 2017 Abstract The present study describes the development and subsequent validation of stability-indicating methods for determination of Milnacipran HCl 'A', Duloxetine HCl 'B', and Pregabalin 'C' each in the presence of its degradation products, using high- performance thin layer chromatographic techniques (HPTLC). The chromatographic development was carried out on HPTLC plates precoated with silica gel 60 F254 using a mixture of acetonitrile-water-ammonia (6+0.6+1.6, v/v/v) as a mobile phase for A, dichloromethane-methanol (8+1, v/v) as a mobile phase for B, and ethyl acetate-methanol-ammonia (6+3+0.1, v/v/v) as a mobile phase for C. Detection was carried out densitometrically at wavelength "220, 230, and 210 nm" respectively. The utilized chromatographic methods were validated according to the international conference on harmonization (ICH) guidelines and successfully applied for determination of the studied drugs in pure form, and in pharmaceutical formulations with good extraction recoveries. All the results were statistically compared with reference methods, where there were no significant differences found. The developed methods were satisfactorily applied to analysis of the investigated drugs and proved to be specific and accurate for quality control procedures in pharmaceutical formulations. Keywords: Fibromyalgia; Duloxetine HCl; Milnacipran HCl; Pregabalin; Stability-indicating HPTLC Introduction Milnacipran HCl (FIG. 1) is an anti-depressant drug. Savella® is generic name for Milnacipran HCl, is a serotonin, serotonin-norepinephrine reuptake inhibitor (SNRI) used in the clinical treatment of fibromyalgia. Fibromyalgia syndrome (FMS) is a complex syndrome characterized by chronic widespread muscular pain associated with other symptoms such as fatigue, cognitive dysfunction, sleep disturbance, depression, anxiety, and stiffness. In January 2009, Milnacipran HCl (under Citation:Abdel-Ghany MF, Abdel-Aziz O, Wafik Eskander E. Stability-indicating HPTLC methods for determination of milnacipran HCl, duloxetine HCl, and pregabalin in bulk drug and pharmaceutical formulations. Anal Chem Ind J. 2017;17(1):117. © 2017 Trade Science Inc. 1
www.tsijournals.com | January-2017 the brand name Savella®) has been approved only for the treatment of fibromyalgia by the Food and Drug Administration (FDA) in the United States for the management of adult FMS patients. Due to its antidepressant activity, Milnacipran HCl can be beneficial to FMS patients with coexisting depression. Inhibition of both neurotransmitters works synergistically to treat both FMS as well as depression. Duloxetine HCl (FIG. 2) is a selective serotonin and norepinephrine reuptake inhibitor (SNRI) used for treating depression, anxiety disorder, and pain associated with diabetic peripheral neuropathy, or fibromyalgia. Many experts believe that an imbalance among neurotransmitters is the cause of depression as well as other psychiatric disorders. Since uptake is an important mechanism for removing released neurotransmitters and terminating their actions on adjacent nerves, the reduced uptake caused by duloxetine HCl increases the effect of serotonin and norepinephrine in the brain. The mechanism responsible for its effectiveness treating pain is not known but also is thought to involve its effects on serotonin and norepinephrine in the brain. Pregabalin (FIG. 3) is an anticonvulsant drug used for neuropathic pain and as an adjunct therapy for partial seizures. It has also been found effective for generalized anxiety disorder. Recent studies have shown that Pregabalin is effective at treating chronic pain in disorders such as fibromyalgia and spinal cord injury. (1R*,2S*)-2-(aminomethyl)-N,N-diethyl-1-phenylcyclopropanecarboxamide FIG. 1. Milnacipran HCl intact drug. (+)-(S)-N-Methyl-3-(naphthalen-1-yloxy)-3-(thiophen-2-yl)propan-1-amine FIG. 2. Duloxetine HCl intact drug. 2
www.tsijournals.com | January-2017 (S)-3-(aminomethyl)-5-methylhexanoic acid FIG. 3. Pregabalin intact drug. No analytical methods were reported in major pharmacopeia like USP, EP and BP. Literature survey revealed many analytical methods for estimation of Milnacipran HCl [1-9], Duloxetine HCl [10-21] and Pregabalin [22-34], however, no stability-indicating HPTLC method has been developed for bulk and pharmaceutical formulations. The above literature revealed that all available methods require large amount of organic solvents or require sophisticated instrument in routine analysis. The major advantage of HPTLC is that several samples can be analyzed simultaneously using a small quantity of mobile phase unlike HPLC. This reduces time and cost of analysis. The aim of this work was to develop an accurate, specific and stability-indicating methods for the determination of Milnacipran HCl, Duloxetine HCl, and Pregabalin in presence of their degradation products as per ICH guidelines. Experimental Chemicals, pharmaceutical formulations, and reagents a)Samples of Milnacipran HCl and Duloxetine HCl-Obtained from Hetero Drugs Ltd (Medak, India). b)Pregabalin-Obtained from Optimus Drugs Ltd (Hyderabad, India). c)25 mg and 50 mg Tablets of Milnacipran HCl (Myodonia®) and 75 mg and 150 mg capsules of Pregabalin (Irenypathic®)-Produced by Amoun Pharmaceuticals Inc. (Cairo, Egypt). d)30 mg and 60 mg capsules of Duloxetine HCl (Cymbatex®)-Produced by EVA Pharmaceuticals (Cairo, Egypt). e)Acetonitrile and methanol-HPLC grade were purchased from Baker (Deventer, The Netherlands). f)Dichloromethane, ammonia, ethyl acetate, hydrochloric acid, sodium hydroxide and potassium permenganate-Analytical reagent grade were purchased from Scharlau (Scharlab S.L, Sentmenat, Spain) g)High purity water-Prepared by using Millipore Milli-Q plus water purification system (Millipore Corp., Billerica, MA). Equipments a)Camag Linomat 5-Semiautomatic application, band application by spray on technique (CAMAG, Muttenz, Switzerland). b)Twin trough glass chamber-20 × 10 (CAMAG). c)TLC scanner 3-Scanning speed up to 100 mm/s, Spectral range 190 nm to 800 nm (CAMAG). d)Stationary phase-Silica gel G60 F254 coated on aluminum sheet (Merck KGaA, Darmstadt, Germany). e)Microliter syringe-CAMAG. 3
www.tsijournals.com | January-2017 f)Hotplate (WiseStir) with temperature controller-Used to carry out degradation studies for all solutions (Daihan Scientific Co. Ltd, Korea). g)Dry air oven (Heraeus)-Used to dry HPTLC plates (Thermo Scientific, Beverly, MA). h)PH-meter (Orion)-Equipped with combined glass electrode for PH adjustment (Thermo Scientific). i) Ultrasonic bath-Elma (Danbury, CT). Preparation of solutions (a) Milnacipran HCl: (1) Stock standard solution-Stock standard solution of Milnacipran HCl (1 mg/mL) was prepared by dissolving 100 mg of the drug in methanol, sonicated and completed to volume with the same solvent in a 100 mL volumetric flask. Forced degradation study of Milnacipran HCl included (acid, alkali, oxidative, and water hydrolysis) stress conditions were performed according to ICH guidelines. (2) Acid-induced forced degradation of Milnacipran HCl (100 µg/mL)-In a conical flask, 30 mL concentrated HCl were added on 5 mL from stock standard solution [Preparation of Solutions (a)(1)], the conical flask was covered with a funnel, heated on a hot plate-adjusted at 180°C-for 13 hours, cooled, then excess HCl was neutralized with 10 M NaOH (approx. 15 mL) using a calibrated PH meter, and completed to 50 mL with methanol. (3) Base-induced forced degradation of Milnacipran HCl (100 µg/mL)-In a conical flask, 5 mL 10M NaOH were added on 5 mL from stock standard solution [Preparation of Solutions (a)(1)], the conical flask was covered with a funnel, heated on a hot plate-adjusted at 180°C-for 90 min, cooled, then excess NaOH was neutralized with 6 M HCl (approx. 7.5 mL) using a calibrated PH meter, and completed to 50 mL with methanol. (4) Oxidative-induced forced degradation of Milnacipran HCl (100 µg/mL)-In a conical flask, 2 mL 0.1 N KMnO4 were added on 5 mL from stock standard solution [Preparation of Solutions (a)(1)], the conical flask was covered with a funnel, heated on a hot plate-adjusted at 100°C-for 90 min, cooled, then 0.5 mL of 4.5 M H2SO4 and 1 M sodium sulphite were added till discoloration, excess sulphuric acid was neutralized with 1 M NaOH using a calibrated pH meter, and completed to 50 mL with methanol. (5) Forced degradation of Milnacipran HCl by water hydrolysis (100 µg/mL)-In a conical flask, 25 mL water were added on 5 mL from stock standard solution [Preparation of Solutions (a)(1)], the conical flask was covered with a funnel, heated on a hot plate-adjusted at 180°C-for 7 hours, cooled, then completed to 50 mL with methanol. (6) Sample preparation-Separately, the contents of 25 mg and 50 mg tablets were mixed, an amount equivalent to 100 mg of Milnacipran HCl was accurately weighed, volume was completed to 100 mL with methanol then sonicated for 15 minutes and filtered. (b) Duloxetine HCl: (1) Stock standard solution-Stock standard solution of Duloxetine HCl (1 mg/mL) was prepared by dissolving 100 mg of the drug in methanol, sonicated and completed to volume with the same solvent in a 100 mL volumetric flask. Forced degradation study of Duloxetine HCl included (acid, alkali, oxidative and water hydrolysis) stress conditions were performed according to ICH guidelines. (2) Acid-induced forced degradation of Duloxetine HCl (100 µg/mL)-In a conical flask, 5 mL 1 N HCl were added on 5 mL from stock standard solution [Preparation of Solutions (b)(1)], the conical flask was covered with a funnel, heated on a hot 4
www.tsijournals.com | January-2017 plate-adjusted at 100°C-for 40 minutes, cooled, then excess HCl was neutralized with1N NaOH (approx. 5 mL) using a calibrated pH meter, and completed to 50 mL with methanol. (3) Base-induced forced degradation of Duloxetine HCl (100 µg/mL)-In a conical flask, 5 mL 10M NaOH were added on 5 mL from stock standard solution [Preparation of Solutions (b)(1)], the conical flask was covered with a funnel, heated on a hot plate-adjusted at 180°C-for 30 min, cooled, then excess NaOH was neutralized with 6 M HCl (approx. 7.5 mL) using a calibrated PH meter, and completed to 50 mL with methanol. (4) Oxidative-induced forced degradation of Duloxetine HCl (100 µg/mL)-In a conical flask, 1 mL 0.1 N KMnO4 was added on 5 mL from stock standard solution [Preparation of Solutions (b)(1)], the conical flask was covered with a funnel, heated on a hot plate-adjusted at 100°C-for 30 min, cooled, then 0.15 mL of 4.5 M H2SO4 and 1 M sodium sulphite were added till discoloration, excess sulphuric acid was neutralized with 1 M NaOH using a calibrated pH meter, and completed to 50 mL with methanol. (5) Forced degradation of Duloxetine HCl by water hydrolysis (100 µg/mL)-In a conical flask, 25 mL water were added on 5 mL from stock standard solution [Preparation of Solutions b(1)], the conical flask was covered with a funnel, heated on a hot plate-adjusted at 180°C-for 80 minutes, cooled, then completed to 50 mL with methanol. (6) Sample preparation-Separately, the contents of 30 mg and 60 mg capsules were mixed, an amount equivalent to 100 mg of Duloxetine HCl was accurately weighed, volume was completed to 100 mL with methanol then sonicated for 15 minutes and filtered. (c) Pregabalin: (1) Stock standard solution-Stock standard solution of Pregabalin (5 mg/mL) was prepared by dissolving 500 mg of the drug in methanol, sonicated and completed to volume with the same solvent in a 100 mL volumetric flask. Forced degradation study of Pregabalin included oxidative stress conditions were performed according to ICH guidelines. (2) Oxidative-induced forced degradation of Pregabalin (1000 µg/mL)-In a conical flask, 10 mL 0.1N KMnO4 were added on 10 mL from stock standard solution [Preparation of Solutions (c) (1)], the conical flask was covered with a funnel, heated on a hot plate-adjusted at 140°C-for 60 min, cooled, then 0.5 mL of 4.5 M H2SO4 and 1M sodium sulphite solution were added till discoloration, excess sulphuric acid was neutralized with 1 M NaOH using a calibrated pH meter, and completed to 50 mL with methanol. (3) Sample preparation-Separately, the contents of 75 mg and 150 mg capsules were mixed, an amount equivalent to 500 mg of Pregabalin was accurately weighed, volume was completed to 100 mL with methanol then sonicated for 15 minutes and filtered. Chromatographic conditions (a) Milnacipran HCl: (1) HPTLC plate-Precoated Silica Gel G60 F254 aluminum sheet (20 cm × 10 cm), with a thickness layer of 0.2 mm as stationary phase. The plate was pre-washed with methanol and allowed to dry in oven at 105°C for 10 minutes. (2) Mobile phase-Different proportions of acetonitrile, water and ammonia were examined, of these, Acetonitrile-water- ammonia (6.0+0.6+1.6, v/v) was found to be the most suitable as a mobile phase. Mobile phase was saturated in Twin trough TLC chamber (20 × 10) for 30 minutes before used for sample analysis. (3) Sample application-Samples were applied at the height of 15 mm as bands 3 mm wide, 10 mm apart on TLC plate with 0.1 μL/second speed. Mobile phase was run up to the distance of 70 mm approximately. The plate was scanned at 220 nm wavelength, the scanned data were analyzed by using win-CATS software. 5
www.tsijournals.com | January-2017 (b) Duloxetine HCl: (1) HPTLC plate-Precoated silica Gel G60 F254 aluminum sheet (20 cm × 10 cm), with a thickness layer of 0.2 mm as stationary phase. The plate was pre-washed with methanol and allowed to dry in oven at 105°C for 10 minutes. (2) Mobile phase-Different proportions of Dichloromethane and methanol were examined, of these, dichloromethane- methanol (8.0+1.0, v/v) was found to be the most suitable as a mobile phase. Mobile phase was saturated in Twin trough TLC chamber (20 × 10) for 30 minutes before used for sample analysis. (3) Sample application-Samples were applied at the height of 15 mm as bands 3 mm wide, 10 mm apart on TLC plate with 0.1 μL/second speed. Mobile phase was run up to the distance of 60 mm approximately. The plate was scanned at 230 nm wavelength, the scanned data were analyzed by using win-CATS software. (c) Pregabalin: (1) HPTLC plate-Precoated silica gel G60 F254 aluminum sheet (20 cm × 10 cm), with a thickness layer of 0.2 mm as stationary phase. The plate was pre-washed with methanol and allowed to dry in oven at 105°C for 10 minutes. (2) Mobile phase-Different proportions of ethyl acetate, methanol and ammonia were examined, of these, ethyl acetate- methanol-ammonia (6.0+3.0+0.1, v/v) was found to be the most suitable as a mobile phase. Mobile phase was saturated in Twin trough TLC chamber (20 × 10) for 30 minutes before used for sample analysis. (3) Sample application-Samples were applied at the height of 15 mm as bands 3 mm wide, 10 mm apart on TLC plate with 0.1 μL/second speed. Mobile phase was run up to the distance of 70 mm approximately. The plate was scanned at 210 nm wavelength, the scanned data were analyzed by using win-CATS software. Method validation (a) Milnacipran HCl: (1) Linearity-5 mL of stock standard solution [Preparation of Solutions (a) (1)] were transferred accurately into a 50 mL volumetric flask and then completed to volume with methanol to produce 100 µg/mL. From this, 1, 2, 3, 4, 5, 6 µL were spotted on an HPTLC plate in triplicate to obtain concentrations of 100, 200, 300, 400, 500, 600 ng/band, respectively. The TLC plate was developed and scanned as mentioned under [Chromatographic Conditions (a)]. The data of peak area versus drug concentration were treated by linear least-squares regression. (2) Accuracy-Assay of drug in bulk powder-The mentioned procedure under [Chromatographic Conditions (a)] was repeated by spotting 5 µL of 80, 100, 120 µg/mL of Milnacipran HCl standard solutions, prepared from stock standard solution [Preparation of Solutions (a)(1)], on an HPTLC plate in triplicate and the concentrations of Milnacipran HCl were calculated by the corresponding regression equation. (3) Specificity-5 µL of placebo prepared solution and five µL of each degrade solution [Preparation of Solutions (a)(2-5)] were spotted on an HPTLC plate in triplicate and the plate was developed and scanned as mentioned under [Chromatographic Conditions (a)]. (4) Precision-Six replicates of same concentration (500 ng per spot of Milnacipran HCl) were checked for repeatability of the sample application and determination of peak area. The intraday and interday variation for the determination of Milnacipran HCl was carried out at three different concentration levels of 400, 500, and 600 ng/spot. (5) Robustness-The robustness of the method was tested by checking the effect of making small deliberate variations on the obtained results, for example, the mobile phase composition, saturation time and quantity of the mobile phase. (6) Limit of detection (LOD) and limit of quantitation (LOQ)-The sensitivity of measurement was estimated in terms of the LOQ and the LOD. The LOQ and LOD were calculated using equations LOD=3 × N/B and LOQ=10 × N/B 6
www.tsijournals.com | January-2017 where N is the standard deviation of the peak area of the drug (n=3), taken as a measure of noise and B is the slope of the corresponding calibration plot. Results are summarized in TABLE 1. (7) Assay of Milnacipran HCl in pharmaceutical dosage forms-For determination of Milnacipran HCl in 25 mg or 50 mg tablets, from the sample solutions [Preparation of Solutions (a)(6)], aliquots were transferred to 50 mL volumetric flasks, completed to volume with methanol to produce 100 µg/mL and then 5 µL were spotted on an HPTLC plate in triplicate and the plate was developed and scanned as mentioned under [Chromatographic Conditions (a)]. Further, standard addition technique was followed: In three separate flasks, accurately measured aliquots of a previously analyzed sample solution of 25 mg tablets [Preparation of Solutions (a)(6)] were transferred into a series of 50 mL volumetric flasks to produce 50 µg/mL each, accurately measured aliquots of standard stock solution [Preparation of Solutions (a)(1)] were added to produce 30, 50, 70 µg/mL each on a flask (60, 100, 140% level), volume was completed to 50 mL with methanol. 5 µL of each solution were spotted on an HPTLC plate in triplicate and the plate was developed and scanned as mentioned under [Chromatographic Conditions (a)]. The same steps were repeated with sample solution 50 mg tablets [Preparation of Solutions (a)(6)]. (b) Duloxetine HCl: (1) Linearity-Five mL of stock standard solution [Preparation of Solutions (b)(1)] were transferred accurately into a 50 mL volumetric flask and then completed to volume with methanol to produce 100 µg/mL. From this, 1, 2, 3, 4, 5, 6 µL were spotted on an HPTLC plate in triplicate to obtain concentrations of 100, 200, 300, 400, 500, 600 ng/band, respectively. The TLC plate was developed and scanned as mentioned under [Chromatographic Conditions (b)]. The data of peak area versus drug concentration were treated by linear least-squares regression. (2) Accuracy-Assay of drug in bulk powder-The mentioned procedure under [Chromatographic Conditions (b)] was repeated by spotting 5 µL of 80, 100, 120 µg/mL of Duloxetine HCl standard solutions, prepared from stock standard solution [Preparation of Solutions (b)(1)], on an HPTLC plate in triplicate and the concentrations of Duloxetine HCl were calculated by the corresponding regression equation. (3) Specificity-Five µL of placebo prepared solution and 5 µL of each degrade solution [Preparation of Solutions (b)(2-5)] were spotted on an HPTLC plate in triplicate and the plate was developed and scanned as mentioned under [Chromatographic Conditions (b)]. (4) Precision-Six replicates of same concentration (500 ng per spot of Duloxetine HCl) were checked for repeatability of the sample application and determination of peak area. The intraday and interday variation for the determination of Duloxetine HCl was carried out at three different concentration levels of 400, 500, and 600 ng/spot. (5) Robustness-The robustness of the method was tested by checking the effect of making small deliberate variations on the obtained results, for example, the mobile phase composition, saturation time and quantity of the mobile phase. (6) LOD and LOQ-The sensitivity of measurement was estimated in terms of the LOQ and the LOD. The LOQ and LOD were calculated by the use of equations LOD=3 × N/B and LOQ=10 × N/B where N is the standard deviation of the peak area of the drug (n=3), taken as a measure of noise and B is the slope of the corresponding calibration plot. Results are summarized in TABLE 1. 7
www.tsijournals.com | January-2017 (7) Assay of Duloxetine HCl in pharmaceutical dosage forms-For determination of Duloxetine HCl in 30 mg or 60 mg capsules, from the sample solutions [Preparation of Solutions (b)(6)], aliquots were transferred to 50 mL volumetric flasks, completed to volume with methanol to produce 100 µg/mL and then 5 µL were spotted on an HPTLC plate in triplicate and the plate was developed and scanned as mentioned under [Chromatographic Conditions (b)]. Further, standard addition technique was followed: In three separate flasks, accurately measured aliquots of a previously analyzed sample solution of 30 mg capsules [Preparation of Solutions (b)(6)] were transferred into a series of 50 mL volumetric flasks to produce 50 µg/mL each, accurately measured aliquots of standard stock solution [Preparation of Solutions (b)(1)] were added to produce 30, 50, 70 µg/mL each on a flask (60%, 100%, 140% level), volume was completed to 50 mL with methanol. 5 µL of each solution were spotted on an HPTLC plate in triplicate and the plate was developed and scanned as mentioned under [Chromatographic Conditions (b)]. The same steps were repeated with sample solution 60 mg capsules [Preparation of Solutions (b)(6)]. (c) Pregabalin: (1) Linearity-Ten mL of stock standard solution [Preparation of Solutions (c)(1)] were transferred accurately into a 50 mL volumetric flask and then completed to volume with methanol to produce 1000 µg/mL. From this 3, 4, 5, 6, 7, 8 µL were spotted on an HPTLC plate in triplicate to obtain concentrations of 3, 4, 5, 6, 7, 8 µg/band, respectively. The TLC plate was developed and scanned as mentioned under [Chromatographic conditions (c)]. The data of peak area versus drug concentration were treated by linear least-squares regression. (2) Accuracy-Assay of drug in bulk powder-The mentioned procedure under [Chromatographic Conditions (c)] was repeated by spotting 5 µL of 800, 1000, 1200 µg/mL of Pregabalin standard solutions, prepared from stock standard solution [Preparation of Solutions (c)(1)], on an HPTLC plate in triplicate and the concentrations of Pregabalin were calculated by the corresponding regression equation. (3) Specificity-Five µL of placebo prepared solution and 5 µL of oxidative-induced degradate solution [Preparation of Solutions (c)(2)] were spotted on an HPTLC plate in triplicate and the plate was developed and scanned as mentioned under [Chromatographic Conditions (c)]. (4) Precision-Six replicates of same concentration (5 µg/spot of Pregabalin) were checked for repeatability of the sample application and determination of peak area. The intraday and interday variation for the determination of Pregabalin was carried out at three different concentration levels of 4, 5, and 6 µg/spot. (5) Robustness-The robustness of the method was tested by checking the effect of making small deliberate variations on the obtained results, for example, the mobile phase composition, saturation time and quantity of the mobile phase. (6) LOD and LOQ-The sensitivity of measurement was estimated in terms of the LOQ and LOD). The LOQ and LOD were calculated by the use of equations LOD=3 × N/B and LOQ=10 × N/B where N is the standard deviation of the peak area of the drug (n=3), taken as a measure of noise and B is the slope of the corresponding calibration plot. Results are summarized in TABLE 1. 8
www.tsijournals.com | January-2017 (7) Assay of Pregabalin in pharmaceutical dosage forms-For determination of Pregabalin in 75 or 150 mg capsules, from the sample solutions [Preparation of Solutions (c)(3)], aliquots were transferred to 50 mL volumetric flasks, completed to volume with methanol to produce 1000 µg/mL and then 5 µL were spotted on an HPTLC plate in triplicate and the plate was developed and scanned as mentioned under [Chromatographic Conditions (c)]. Further, standard addition technique was followed: In three separate flasks, accurately measured aliquots of a previously analyzed sample solution of 75 mg capsules [Preparation of Solutions (c)(3)] were transferred into a series of 50 mL volumetric flasks to produce 500 µg/mL each, accurately measured aliquots of standard stock solution [Preparation of Solutions (c)(1)] were added to produce 300, 500, 700 µg/mL each on a flask (60, 100, 140% level), volume was completed to 50 mL with methanol. Five µL of each solution were spotted on an HPTLC plate in triplicate and the plate was developed and scanned as mentioned under [Chromatographic Conditions (c)]. The same steps were repeated with sample solution 150 mg capsules [Preparation of Solutions (c)(3)]. Results and Discussion The main purpose of our HPTLC method development and validation was to design stability-indicating methods for determination of Milnacipran HCl, Duloxetine HCl, and Pregabalin. The analysis of both pure drugs as well as of degraded products were tried in different solvent systems and different mobile phase composition to achieve good resolution. Method validation Linearity-A calibration curve was constructed by plotting peak area against concentration (ng/spot). The results of regression analysis are shown in TABLE 1 and FIG. 4-6. They confirm the linearity of the standard curves over the range studied (100 ng/spot to 600 ng/spot=0.1 µg/spot to 0.6 µg/spot) for Milnacipran HCl and Duloxetine HCl, (3 µg/spot to 8 µg/spot) for Pregabalin. The 3-D chromatograms of all calibration concentrations are shown in FIG. 7- 9, respectively. TABLE 1. Calibration data for the determination of Milnacipran HCl, Duloxetine HCl and Pregabalin. r2 Drug Range Regression equatio n (Y=bC+a)a LOD, LOQ, Repeatability Intraday Interday µg/spot μg/spot μg/spot RSD% RSD % RSD % 0.957 0.468 0.226 Milnacipran 0.1-0.6 y=2981x + 51.76 0.9996 0.018 0.055 HCl 0.833 0.122 0.268 Duloxetine 0.1-0.6 y=11562x -71.60 0.9995 0.019 0.059 HCl 1.187 0.206 0.244 Pregabalin 3-8 y=1037x - 2055 0.9999 0.071 0.216 aa=Intercept, b=slope, and C=concentration of drug in μg/spot 9
www.tsijournals.com | January-2017 FIG. 4. Calibration curve of Milnacipran HCl (0.1 µg/spot to 0.6 µg/spot). FIG. 5. Calibration curve of Duloxetine HCl (0.1 µg/spot to 0.6 µg/spot). FIG. 6. Calibration curve of Pregabalin (3 µg/spot to 8 µg/spot). 10
www.tsijournals.com | January-2017 FIG. 7. 3D graph of calibration linearity graph of Milnacipran HCl. FIG. 8. 3D graph of calibration linearity graph of Duloxetine HCl. FIG. 9. 3D graph of calibration linearity graph of Pregabalin. 11
www.tsijournals.com | January-2017 Accuracy-The accuracy of the developed methods were determined by calculating % recoveries of three different concentrations of each drug in bulk powder. Concentrations were calculated from the corresponding regression equations. Results are summarized in TABLE 2. TABLE 2. Results of recovery studies of Milnacipran HCl, Duloxetine HCl and Pregabalin. Milnacipran HCl Duloxetine HCl Pregabalin Theoretical conc Actual Recover Theoretical conc Actual conc Recov Theoretical con Actual conc Recove (µg/mL) conc found y% (µg/mL) found ery% c (µg/mL) found ry% (µg/mL) (µg/mL) (µg/mL) 80 (400 ng/spot) 78 97.5 80 (400 ng/spot) 79 98.75 800 (4 µg/spot) 795 99.37 100 (500 ng/spot) 98 98.00 100 (500 ng/spot) 98 98.00 1000 (5 1008 100.80 µg/spot) 120 (600 ng/spot) 120 100.00 120 (600 ng/spot) 118 98.33 1200 (6 1204 100.33 µg/spot) Specificity-The developed methods were found to be specific and selective. Each intact drug can be detected without interference from its degradation products or excipients in placebo as shown in FIG. 10-24. Recovery and relative standard deviations were calculated. Results are summarized in TABLE 4. TABLE 3. Application of standard addition technique for the determination of Milnacipran HCl, Duloxetine HCl, and Pregabalin in formulation. Dosage form Drug Claimed conc. Std conc. added Recovery% RSD% 25mg tab 101.03 0.265 30 µg/mL 50 mg tab 98.51 0.459 25mg tab 99.08 0.655 Milnacipran HCl 50 µg/mL 50 µg/mL 50 mg tab 98.36 0.052 25mg tab 99.65 0.483 70 µg/mL 50 mg tab 98.33 0.167 30 mg cap 99.12 0.297 30 µg/mL 60 mg cap 99.32 0.197 30 mg cap 99.88 0.363 Duloxetine HCl 50 µg/mL 50 µg/mL 60 mg cap 101.42 0.125 30 mg cap 98.12 0.144 70 µg/mL 60 mg cap 101.74 0.045 12
www.tsijournals.com | January-2017 75 mg cap 101.39 0.598 300 µg/mL 150 mg cap 101.80 0.216 75 mg cap 101.76 0.226 Pregabalin 500 µg/mL 500 µg/mL 150 mg cap 100.17 1.73 75 mg cap 99.13 0.153 700 µg/mL 150 mg cap 98.58 0.049 FIG. 10. Alkaline hydrolysis of Milnacipran HCl. 13
www.tsijournals.com | January-2017 FIG. 11. Oxidative hydrolysis of Milnacipran HCl. FIG. 12. Water hydrolysis of Milnacipran HCl. 14
www.tsijournals.com | January-2017 FIG. 13. Standard Milnacipran HCl. FIG. 14. Placebo of Myodonia® tablets. 15
www.tsijournals.com | January-2017 FIG. 15. Acid hydrolysis of Milnacipran HCl. FIG. 16. Acid hydrolysis of Duloxetine HCl. 16
www.tsijournals.com | January-2017 FIG. 17. Alkaline hydrolysis of Duloxetine HCl. FIG. 18. Oxidative hydrolysis of Duloxetine HCl. 17
www.tsijournals.com | January-2017 FIG. 19. Placebo of Cymbatex® capsule. FIG. 20. Standard Duloxetine HCl. 18
www.tsijournals.com | January-2017 FIG. 21. Water hydrolysis of Duloxetine HCl. FIG. 22. Oxidative hydrolysis of Pregabalin. 19
www.tsijournals.com | January-2017 FIG. 23. Placebo of Irenypathic® capsule. FIG. 24. Standard Pregabalin. Precision-The repeatability of sample application and measurement of peak area were expressed in terms of relative standard deviation (%RSD). The intra- and inter-day precision was evaluated by assaying freshly prepared samples in triplicate, as shown in TABLE 1. 20
www.tsijournals.com | January-2017 Robustness-The developed methods were robust, since %RSD was found to be less than 2.0% after introducing deliberate small changes in the mobile phase composition, saturation time and quantity of the mobile phase. Analytical applications-The results obtained by applying the proposed methods for the determination of concentration of Milnacipran HCl, calculated from the corresponding regression equation, average recovery of 25 mg tablets was found to be 101.64% and that of 50 mg tablets was found to be 98.4%, Duloxetine HCl, average recovery of 30 mg capsules was found to be 102.5% and that of 60 mg capsules was found to be 97.7% and Pregabalin, average recovery of 75 mg capsules was found to be 101.29% and that of 150 mg capsules was found to be 102.79%. Further, standard addition technique followed to check the validity of the method, gave good recoveries of the drug in presence of formulation suggesting non-interference from formulation excipients. TABLE 4. Results of stress degradation studies of Milnacipran HCl, Duloxetine HCl, and Pregabalin. Drug Degradate Degradation products %Degradation of (Rf value) intact Drug Milnacipran 1-Acid-induced degradate [Preparation of Solutions (a)(2)] 1- (0.12,0.14,0.23) 1% to 77.4% HCl 2- Base-induced degradate [Preparation of Solutions (a)(3)] 2- (0.16) 2% to 75.3% 3- Oxidative-induced degradate [Preparation of Solutions 3- (0.03, 0.08) 3% to 25.7% (a)(4)] 4- (0.01) 4% to 9% 4- Water hydrolysis degradate [Preparation of Solutions (a)(5)] Duloxetine 1- Acid-induced degradate [Preparation of Solutions (b)(2)] 1- (0.05, 0.08, 0.14, 1% to 100% HCl 0.17) 2- Base-induced degradate [Preparation of Solutions (b)(3)] 2% to 100% 2- (0.06, 0.09, 0.13, 0.16) 3% to 100% 3- Oxidative-induced degradate [Preparation of Solutions 3- (0.01, 0.04, 0.15, (b)(4)] 0.18) 4- (0.03, 0.12, 0.17, 0.2) 4% to 64.3% 4- Water hydrolysis degradate [Preparation of Solutions (b)(5)] Oxidative-induced degradate [Preparation of Solutions (c)(2)] Pregabalin (0.6) 24.1% Statistical analysis-A statistical comparison of the results obtained by the proposed methods and the reference methods for determination of Milnacipran HCl, Duloxetine HCl, and Pregabalin was done. The significant difference between groups were tested by t-test as shown in TABLE 5. The test ascertained that there was no significant difference with respect to accuracy and precision between the proposed methods and the reference methods [7,21,32]. 21
www.tsijournals.com | January-2017 TABLE 5. Statistical comparison between the results of the proposed methods and the reference methods for the determination of Milnacipran HCl, Duloxetine HCl, and Pregabalin. Milnacipran HCl Duloxetine HCl Statistical term Statistical term Proposed Ref method Proposed method Ref method method Accuracy Accuracy mean recovery 100.17 99.92 mean recovery 100.45 99.04 RSD% mean 0.802 0.468 RSD% mean 0.683 0.268 Variance 0.861 1.007 Variance 0.001 0.781 t-test 2.776 0.313 t-test 2.776 2.745 (t-tabulated) (t-calculated) (t-tabulated) (t-calculated) Precision-intraday Precision-intraday mean recovery 99.95 99.67 mean recovery 99.99 100.33 RSD% mean 0.556 0.468 RSD% mean 0.333 0.122 Variance 0.017 0.366 Variance 0.003 0.274 t-test 2.776 0.784 t-test 2.776 1.116 Precision-interday Precision-interday mean recovery 99.99 99.93 mean recovery 99.89 100.17 RSD% mean 0.459 0.226 RSD% mean 0.353 0.268 Variance 0.017 3.534 Variance 0.009 2.013 t-test 2.776 0.050 t-test 2.776 0.347 Pregabalin statistical term ref method proposed method Accuracy mean recovery 100.22 100.76 Variance 1.149 2.033 RSD% mean 1.069 0.326 t-test 2.776 0.524 (t-tabulated) (t-calculated) Precision-intraday RSD% mean 1.267 0.206 Variance 0.211 0.005 t-test 2.776 -3.949 Precision-interday RSD% mean 1.072 0.244 Variance 0.583 0.058 t-test 2.776 1.79 22
www.tsijournals.com | January-2017 Conclusion The paper describes simple, inexpensive, precise, accurate, and sensitive methods for determination of Milnacipran HCl, Duloxetine HCl, and Pregabalin in bulk drug as well as in pharmaceutical dosage forms, also, can separate the drug from its degradation products, so, can be described as stability-indicating assay methods. The minimum sample preparation and the speed of analysis are the main advantages of these methods over other analytical procedures, unlike the HPLC procedures, the instrument is simple and inexpensive using a small quantity of reagents, thus, cost and time saving. Acknowledgments Authors are thankful to EVA Pharmaceuticals for providing gift sample of Duloxetine hydrochloride and Amoun Pharmaceuticals for providing excellent facilities for carrying out this research work. REFERENCES 1.Rao MS, Sivaramakrishna V, Vardhan SVM, et al. A validated RP-HPLC method for the estimation of Milnacipran in tablet dosage forms. Int J Chem Tech Res. 2011;3(3):1501-5. 2.Mubarakunnisa MD, Prameela RA, Harika S. Int J Pharm. 2012;2(4):801-5. 3.http://www.pharmascholars.com. 4.Mehta PJ, Khatri DM. Development and validation of RP-HPLC method for determination of milnacipran hydrochloride in pharmaceutical formulations. Int J Pharmacy Pharm Sci. 2010;2(2):137-41. 5.Lakshmi MV, Rao JVLNS, Kumar BNVR. Development and validation of RP-HPLC method for the estimation of rasagiline tablet dosage forms. Int J Res pharm chem. 2011;1(1):40-3. 6.Tondepu N, Sait SS, Surendranath KV, et al. A stability indicating U-HPLC method for Milnacipran in bulk drugs and pharmaceutical dosage forms. Am J Anal Chem. 2012;3:40-9. 7.Dias CL, Bajerski L, Rossi RC, et al. Comparative validation study to assay Milnacipran hydrochloride in capsules by a Stability-Indicating LC and a Second Order Derivative UV Spectroscopic Methods. Pharm Anal Acta. 2010;1(2):1-5. 8.Singhvi G, Shukla VK, Ukawala R, et al. Development of a new, rapid and sensitive HPTLC method for estimation of Milnacipran in bulk, formulation and compatibility study. Arabian J Chem. 2013. 9.Dias CL, Bajerski L, Rossi RC, et al. Dissolution method for Milnacipran hydrochloride capsules: Development, validation, and study of changes in dissolution rate after storage. Dissolut Technol. 2011;18(3):47-53. 10.Nautiyal K, Ramakrishna K. Method development and validation for determination and quantitative estimation of impurities in milnacipran hydrochloride by liquid chromatography technique. J Chem Pharm Res. 2014;6(10):358- 66. 11.Patel SK, Patel NJ, Patel U, et al. Validation of a stability-indicating HPTLC method for analysis of Duloxetine hydrochloride in capsule dosage form. Separation and analysis of Duloxetine hydrochloride and Olanzapine in a synthetic mixture. J Planar Chromat-Modern TLC. 2009;22(2):121-6. 12.Dasari S, Viriyala RK, Santosh K, et al. A validated RP-HPLC method for the analysis of duloxetine hydrochloride in pharmaceutical dosage forms. Global Pharmacy 2010.3(3):1-3. 23
www.tsijournals.com | January-2017 13.Dhakane VD, Ubale MB. A validated stability-indicating HPLC assay method for Irinotecan Hcl in bulk drug. Int J Res Pharm Bio Sci. 2011;2(4):1711-7. 14.Bhimanadhuni CN, Garikapati DR, Srinivas C. Development and validation of RP-HPLC method for determination of Duloxetine hydrochloride in bulk and dosage form. Int curr pharm J. 2012;1(5):98-102. 15.Battu PR. Validation and stability indicating reverse phase-high performance liquid chromatography for the determination of Duloxetine in tablets. Int J ChemTech Res. 2009;1(3) 602-5. 16.Prabu SL, Srinivasan M, Thiyagarajan S. Determination of Duloxetine hydrochloride in pharmaceutical formulation by HPLC with UV detection. Int J ChemTech Res. 2010;2(3):1441-4. 17.Rao DD, Sait SS, Reddy AM, et al. Analysis of Duloxetine hydrochloride and its related compounds in pharmaceutical dosage forms and in vitro dissolution studies by stability indicating UPLC. J Chromatogr Sci. 2010;48:819-24. 18.Bhimavarapu R, Durga GR, Mukarji P, et al. Int J Inv Pharm Sci. 2013;1(1) 25-9. 19.Dhaneshwar SS, Deshpande P, Patil M, et al. Development and validation of a HPTLC method for estimation of duloxetine hydrochloride in bul drug and in tablet dosage form. Indian J Pharm Sci. 2008:70(2):233-6. 20.Datar PA, Waghmare RU. Development and validation of an analytical method for the stability of Duloxetine hydrochloride. J Taibah University Sci. 2014;8:357-63. 21.Srinivasulu PKSV, Srinivas RS, Reddy K, et al. A validated stability indicating rapid LC method for duloxetine HCl. Pharmazie. 2009;64(1):10-13. 22.Shahnawaz S, Siddiqui A, Masroor T, et al. Stability-Indicating HPTLC Method for Determination of Duloxetine Hydrochloride in Bulk Drug and Tablet Formulation. Chromatogr Res Int. 2011;1-5. 23.Shah DA, Patelia EM, Mori A. Simultaneous estimation of Pregabalin and Methyl cobalamine in pharmaceutical formulation by HPTLC-densitometry method. J Chromatogr Separat Techniq. 2013; 4(2):169-72. 24.Shep SG, Lahoti SR. Development and validation of UV spectrophotometric method of Pregabalin in bulk and pharmaceutical formulation. Int J ChemTech Res. 2013;5(5):1264-70. 25.Kasawar GB, Farooqui MN. Development and validation of HPLC method for the determination of Pregabalin in Capsules Indian. J Pharm Sci. 2010;72(4):517-9. 26.Vukkum P, Babu JM, Muralikrishna R. Stress degradation behavior of Pregabalin, identification of degradation impurities and development of stability indicating UPLC method. Int J Pharm Sci Res. 2015;6(6):2241-57. 27.Reddy MNC, Sekhar KBC, Int. J Chem Pharm Sci. 2012;3(2):40-6. 28.Gujral RS, Haque SKM, Kumar S. A novel method for the determination of pregabalin in bulk pharmaceutical formulations and human urine samples. Afr J Pharm Pharmacol. 2009;3(6):327-34. 29.Mishra SK, Gurupadhyya BM, Verma S. Stability indicating RP-HPLC method for determination of Pregabalin using ICH guidelines. Int J Nat Prod Sci. 2012;1:115-6. 30.Walash MI, Belal FF, El-Enany NM, et al. Simple and sensitive spectrofluorimetric method for the determination of pregabalin in capsules through derivatization with fluorescamine Luminescence. 2011;26:342-8. 31.Prasad MKC, Sagar GV, Sudhakar P. Simultaneous HPTLC Method for Estimation of Gabapentin and Pregabalin. Int J Pharm Pharm Sci. 2013;5(4):326-33. 32.Kumar BSJ, Kumar RV, Sinha VR. Stability indicating HPTLC method for the determination of pregabalin in bulk and pharmaceutical dosage forms. Anal Chem Ind J. 2013;12(10):377-83. 24
www.tsijournals.com | January-2017 33.Saleh HM, EL Henawee MM, Ragab GH, et al. Spectrophotometric and spectrofluorimetric determination of pregabalin via condensation reactions in pure form and in capsules. Int Res J Pharm Biol Chem Sci. 2014;4(3):738- 47. 25