Download
1 / 6
60 likes | 116 Vues
(–8) 2(2). –. –. x =. = 2. =. b 2 a. Standard 8.0. Graph a function of the form y = ax 2 + bx + c. Graph y = 2 x 2 – 8 x + 6. SOLUTION. STEP 1.

E N D
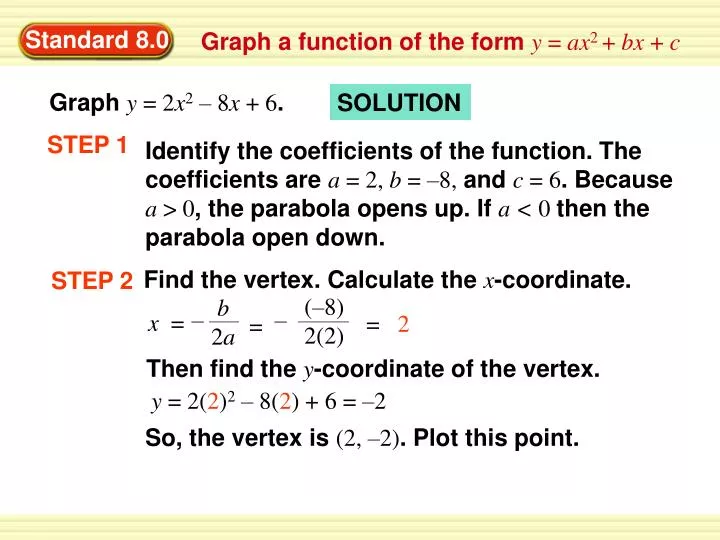
(–8) 2(2) – – x = = 2 = b 2a Standard 8.0 Graph a function of the form y = ax2 + bx + c Graph y = 2x2 – 8x + 6. SOLUTION STEP 1 Identify the coefficients of the function. The coefficients are a = 2, b = –8, and c = 6. Because a > 0, the parabola opens up. If a < 0 then the parabola open down. Find the vertex. Calculate the x-coordinate. STEP 2 Then find the y-coordinate of the vertex. y = 2(2)2– 8(2) + 6 = –2 So, the vertex is (2, –2). Plot this point.
Standard 8.0 Graph a function of the form y = ax2 + bx + c STEP 3 Draw the axis of symmetry x = 2. STEP 4 Identify the y-intercept c, remember that the graph intercepts the y axis when x = 0 . So we plug in x = 0 into our original equation y = 2(0)2– 8(0) + 6 = 6 Plot the point (0, 6). Then reflect this point in the axis of symmetry to plot another point, (4, 6). STEP 5 Solve the equation by any of the three methods (factoring, completing the square or using the quadratic formula). The solutions are x = 3 and x = 1 plot the points (3,0) and (1,0) on the “x”axis.
EXAMPLE 1 Graph a function of the form y = ax2 + bx + c STEP 6 Draw the axis of symmetry x = 2. Plot the point (0, 6). Then reflect this point in the axis of symmetry to plot another point (4, 6). Plot the points (3,0) and (1,0) on the “x”axis.
EXAMPLE 1 Graph a function of the form y = ax2 + bx + c Draw a parabola through the plotted points. STEP 6
for graphing quadratic equations GUIDED PRACTICE Graph the function. Label the vertex and axis of symmetry. 5. y = 2x2 + 6x + 3 4. y = x2 – 2x – 1
6. f (x) = x2 – 5x + 2 – 1 3 for graphing quadratic equations GUIDED PRACTICE