Download
1 / 27
270 likes | 292 Vues
This study analyzes different scenarios and calculates probabilities to make informed decisions. It covers topics such as employee satisfaction, police promotions, discrimination cases, assigning probabilities, mutual exclusiveness and independence, expected values, and maximizing profits.

E N D
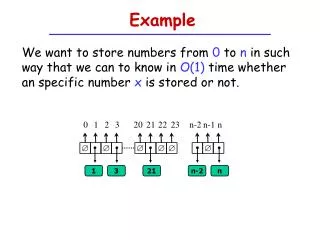
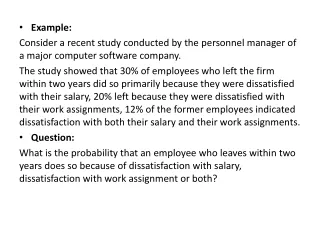
Example: Consider a recent study conducted by the personnel manager of a major computer software company. The study showed that 30% of employees who left the firm within two years did so primarily because they were dissatisfied with their salary, 20% left because they were dissatisfied with their work assignments, 12% of the former employees indicated dissatisfaction with both their salary and their work assignments. • Question: What is the probability that an employee who leaves within two years does so because of dissatisfaction with salary, dissatisfaction with work assignment or both?
The police force consists of 1200 officers of which 960 are men and 240 are women. Over the past two years, 324 officers on the police force received promotions. Table: Promotion status of Police Officers over the past two years. Let; M : Event an officer is a man W : Event an officer is a woman A : Event an officer is promoted Ac : Event an officer is NOT promoted Q: Find the joint and marginal probabilities. What is the probability that an officer is promoted given that the officer is a man?
A committee of female officers raised a discrimination case on the basis that 288 male officers had received promotions but only 36 female officers had received promotions. Q: Is this argument true? If yes; What could be the criteria that supported this argument? If not; Why?
P(E1) + P(E2) + . . . + P(En) = 1 Assigning Probabilities • Basic Requirements for Assigning Probabilities 2. The sum of the probabilities for all experimental outcomes must equal 1. where: n is the number of experimental outcomes
Multiplication Law The multiplication law provides a way to compute the probability of the intersection of two events. The law is written as: P(AB) = P(B)P(A|B)
Mutual Exclusiveness and Independence Do not confuse the notion of mutually exclusive events with that of independent events. Two events with nonzero probabilities cannot be both mutually exclusive and independent. If one mutually exclusive event is known to occur, the other cannot occur.; thus, the probability of the other event occurring is reduced to zero (and they are therefore dependent). Two events that are not mutually exclusive, might or might not be independent.
A game is played using one die. If the die is rolled and shows 1, the player wins $5. If the die shows any number other than 1, the player wins nothing. If there is a charge of $1 to play the game, what is the game’s expected value? What does this value mean?
A construction company is planning to bid on a building contract. The bid costs the company $1500. The probability that the bid is accepted is 1/5 . If the bid is accepted, the company will make $40,000 minus the cost of the bid. Find the expected value in this situation. Describe what this value means.
It is estimated that there are 27 deaths for every 10 million people who use airplanes. A company that sells flight insurance provides $100,000 in case of death in a plane crash. A policy can be purchased for $1. Calculate the expected value and thereby determine how much the insurance company can make over the long run for each policy that it sells.
A 25-year-old can purchase a one-year life insurance policy for $10,000 at a cost of $100. Past history indicates that the probability of a person dying at age 25 is 0.002. Determine the company’s expected gain per policy. .
A store specializing in mountain bikes is to open in one of two malls. If the first mall is selected, the store anticipates a yearly profit of $300,000 if successful and a yearly loss of $100,000 otherwise. The probability of success is 1/2 . If the second mall is selected, it is estimated that the yearly profit will be $200,000 if successful; otherwise, the annual loss will be $60,000. The probability of success at the second mall is 3/4 . Which mall should be chosen in order to maximize the expected profit? .
An oil company is considering two sites on which to drill, described as follows: Which site has the larger expected profit? By how much?
Example-1: An insurance company sells a 10,000 TRL 1-year term insurance policy at an annual premium of 290 TRL. Based on many year’s information, the probability of death during the next year for a person of customer’s age, sex, health etc. is 0.001 Q: What is the expected gain (amount of money made by the company) for a policy of this type?
Example -2 Medical Research has shown that a certain type of chemotherapy is successful 70% of the time when used to treat the skin cancer. Suppose 5 skin cancer patients are treated with chemotherapy Let x be the number of successful cures out of five The probability distribution Table for r.v. X is given as; X: 0 1 2 3 4 5 F(x): 0.002 0.029 0.132 0.309 0.360 0.168 • E(x)=? • St.Dev.(x)=? • Graph of f(x)=? And Interval of µ ± 2σ=? • Use either Chebyshev’s or Empirical to approximate the probability that x falls in this interval. • Compare the results with actual probabilities.
Example: 1 Test the following function to determine whether it is a probability function. If it is not, try to make it into a probability function S(x) = (6 - |x – 7|) / 36 , for x =2, 3, 4, 5, 6, 7, . . . , 11, 12 a. List the distribution of probabilities and sketch a histogram. b. Do you recognize S(x)? If so, identify it.
Example: 2 The College Board website provides much information for students, parents, and professionals with respect to the many aspects involved in Advanced Placement (AP) courses and exams. One particular annual report provides the percent of students who obtain each of the possible AP grades (1 through 5). The 2008 grade distribution for all subjects was as follows: AP Grade Percent 1 20.9 2 21.3 3 24.1 4 19.4 5 14.3 a. ) Express this distribution as a discrete probability distribution. b. ) Find the mean and standard deviation of the AP exam scores for 2008.
Q: A clothing manufacturer must decide whether to spend a considerable sum of money to build a new factory. The following table represent the information about the profits and deficits called Payoff Table: If the clothing manufacturer feels that the probabilities for a good sales year or a poor sales year are, respectively, 0.40 and 0.60, would building the new factory maximize his expected profit?
Properties of the Binomial Probability Distributions 1- The experiment consists of a sequence of n identical trials 2- Two outcomes (SUCCESS and FAILURE ) are possible on each trial 3- The probability of success, denoted by p, does not change from trial to trial. Consequently, the probability of failure, denoted by q and equals to 1-p , does not change from trial to trial 4- The trials are independent.
Example :4 The Heart Association claims that only 10% of adults over 30 can pass the minimum requirements of Fitness Test. Suppose four adults are randomly selected and each is given the fitness test. Use the formula for a binomial random variable to find the probability distribution of x, where x is the number of adults who pass the fitness test. Graph the distribution.