Download
1 / 15
150 likes | 250 Vues
A focus on methods, models and algorithms that have broad application to the geosciences c ontribute cyberinfrastructure to the NSF community. CISL and science. Research concentrations: Numerical methods and Algorithm scaling Data assimilation and Data analytics

E N D
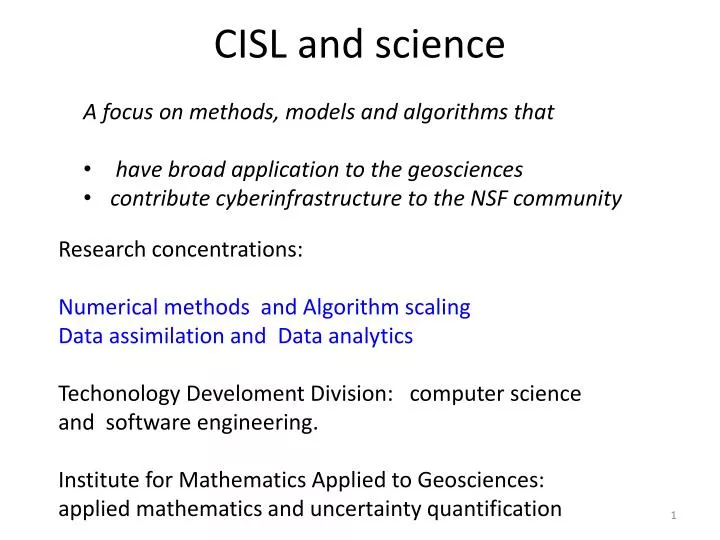
A focus on methods, models and algorithms that • have broad application to the geosciences • contribute cyberinfrastructure to the NSF community CISL and science Research concentrations: Numerical methods and Algorithm scaling Data assimilation and Data analytics TechonologyDeveloment Division: computer science and software engineering. Institute for Mathematics Applied to Geosciences: applied mathematics and uncertainty quantification
Data Assimilation Data Assimilation: combining observations with a numerical model to produce an improved forecast or prediction. Science highlight: Assimilation for the Community Earth System Model Community Connections: Data Assimilation Research Testbed (DART)
Develop assimilation capability for the ocean model component (POP) of CESM • Pressing need for initial fields for IPCC decadal climate predictions. • Will aid in model calibration and development. • Prototype for fully coupled earth system model assimilation. • Ensembles allow for uncertainty quantification.
World Ocean Database T,S observation counts These counts are for 1998 & 1999 and are representative. FLOAT_SALINITY 68200 FLOAT_TEMPERATURE 395032 DRIFTER_TEMPERATURE 33963 MOORING_SALINITY 27476 MOORING_TEMPERATURE 623967 BOTTLE_SALINITY 79855 BOTTLE_TEMPERATURE 81488 CTD_SALINITY 328812 CTD_TEMPERATURE 368715 STD_SALINITY 674 STD_TEMPERATURE 677 XCTD_SALINITY 3328 XCTD_TEMPERATURE 5790 MBT_TEMPERATURE 58206 XBT_TEMPERATURE 1093330 APB_TEMPERATURE 580111 • temperature observation error standard deviation == 0.5 K. • salinity observation error standard deviation == 0.5 msu. AMS New Orleans 2012
Physical Space: 1998/1999 SST Anomaly from HadOI-SST • POP forced by observed atmosphere (hindcast) Coupled Free Run POP forced by hindcast DART Assimilations 23 POPs / 1 CAM 48 POPs / 48 CAM
DART is used at: 43 UCAR member universities More than 100 other sites • Public domain software for Data Assimilation • Well-tested, portable, extensible, free! • Models • Toy Examples • Global (7) , Regional (5), Chemistry (2), Ocean (4), Upper atm. (3), and CLM. • Observations • Real, synthetic, novel • An extensive Tutorial in MATLAB • With examples, exercises, explanations DART is cited in 15 CESM talks and 12 posters at June Breckenridge meeting
Data Analytics Data Analytics:The discovery and communication of meaningful patterns in data. Science Highlight: Western US precipitation extremes in regional models and observations • Community Connections: • Extremes Toolkit • NSF Math Institutes
Daily Precipitation for the Western US How well does a regional climate model simulate extremes? Gridded Daily Obs WRF / NCEP • Maximum of Daily precipitation in 200 km footprint over study region • Found for 1981 -1999. • Regional climate model runs a small subset of NARCCAP
Analysis of dependence between extremes Frechet scale Original Scale (mm) Observed Daily Max Frechet Observed WRF Daily Max Frechet WRF • Correlations on original scale are not appropriate. • Analysis on Frechetscale, appropriate for extremes, • indicates a significant dependence. • some extremes associated with Pineapple Express.
Connections to community • Training: Extremes project CSU PhD student (Grant Weller); faculty advisor a former CISL post doc (Dan Cooley). • On average 3 statistics post docs/year in CISL has linked NCAR to the statistics research community. • Visitors • NCAR node in NSF Math/Climate Research Networks: • Statistics Methods for Atmosphere and Ocean sciences • Mathematics and Climate Research Network • NSF Math Institutes • SAMSI, MSRI, IMA, BIRS
Conclusions • Many other highlights in numerics, multi-scale modeling, regional climate, … • Visitors • Theme-of-the-year ??? • Training.
Extremes toolkit in R Filled the need for introducing modern statistical analysis of extremal data to the climate community Interactive analysis for the tail of a distribution using extreme value theory > 700 registrations Uses the R Statistical Environment, a community based and open source activity