Download
1 / 42
420 likes | 425 Vues
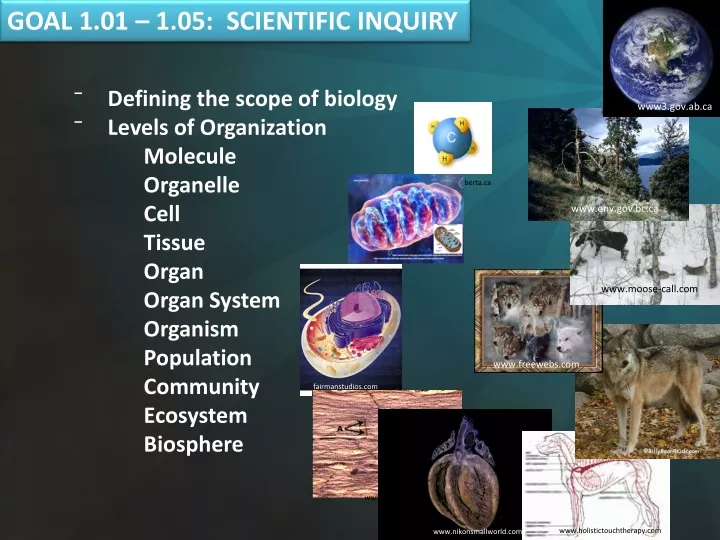
GOAL 1.01 – 1.05: SCIENTIFIC INQUIRY. Defining the scope of biology Levels of Organization Molecule Organelle Cell Tissue Organ Organ System Organism Population Community Ecosystem Biosphere. www3.gov.ab.ca. www.energy.alberta.ca. www.env.gov.bc.ca. www.moose-call.com.

E N D
GOAL 1.01 – 1.05: SCIENTIFIC INQUIRY • Defining the scope of biology • Levels of Organization • Molecule • Organelle • Cell • Tissue • Organ • Organ System • OrganismPopulationCommunity • Ecosystem • Biosphere www3.gov.ab.ca www.energy.alberta.ca www.env.gov.bc.ca www.moose-call.com www.freewebs.com www.gwc.maricopa.edu fairmanstudios.com www.holistictouchtherapy.com www.nikonsmallworld.com
Two main approaches to learning about nature • Discovery Science = gather data by verifiable observations & measurements • Ex. Baby bats cling to their mother in flight. • Ex. Sequence of DNA (an observation) • Hypothesis-Driven Science = conclusions drawn from observations taken during “discovery science” lead to more questions. • Ex. Why do baby bats cling to their mother in flight? Ex. What is the function of the DNA sequence? www.sciencedaily.com
Hypothesis = tentative or educated guess to a problem that is being asked. • Ex. Bats are observed following the route of a river when flying from their camp to the feeding site. • Prior knowledge: Bats have excellent night vision. • Hypothesis: The bats are using the river as a visual aid to navigation. media-cdn.tripadvisor.com
Forming Hypotheses (Practice): • Observation: Concentrations of Carbon Monoxide in the air increase between 8-10 a.m. and again between 4-6 p.m. • Knowledge: Cars emit Carbon Monoxide. The carbon in these emissions combines with oxygen in the air to create carbon dioxide. • Hypothesis: Carbon Dioxide increases with the increase in traffic patterns during a normal work day. blog.arendsen.net
The Scientific Method = steps followed to pose and test hypotheses. • Six Steps of the Scientific Method: • Observation – from others or results of earlier tests • Questions – about unclear aspects of the observations • Hypotheses – tentative explanations of the phenomenon phrased in such a way as to be testable • Predictions – logical, testable outcomes of the hypotheses developed by the use of deductive reasoning (if-then). • Tests – to determine if the predictions are supported or falsified. • (works not by proving but by disproving) • 6. Results – used as evidence to support or falsify the hypothesis.
Manipulated Variable = variable that you do something to. Responding Variable = what you measure Control = a group within your experiment that receives no changes Qualitative Study = uses descriptions Deals with descriptions. Data can be observed but not measured. Colors, textures, smells, tastes, appearance, beauty, etc. Qualitative → Quality Quantitative Study = uses numbers Deals with numbers. Data which can be measured. Length, height, area, volume, weight, speed, time, temperature, humidity, sound levels, cost, members, ages, etc. Quantitative → Quantity listverse.com Redi and Pasteur Experiment Showing Scientific Method http://www.sumanasinc.com/webcontent/animations/content/scientificmethod.html
Example Procedure: • Label two beakers. • Add 100 ml water to each. • Measure and add 10 g salt to one beaker. • Stir to dissolve. • Heat. Record the temperature when the water in each beaker boils. • Variable is any factor that can affect the results. • Variables in this experiment: • Beaker sizes, amount of water, amount of salt, and heating method. Apply the concepts and key words you have learned to the following example. Misty wants to determine if water boils faster when salt is added. She believes water will boil faster if salt is added. Her hypothesis is “Salt water boils faster than unsalted water.”
Manipulated variable = Responding variable = Control Group = Conclusion = Salt Boiling Point 1 L water group Salt does increase the Boiling Point of water.
What prediction can you make based on these data? If 3 tbl salt are added to 1 L water, the boiling point will be higher than 103.4 C.
Q. Suzanne wanted to test how light affects the growth of plants. She will measure the number of cm each plant grows. • Which two groups should Suzanne use for her experiment? • A. Suzanne should use Group A and B. • 2. What variable is Suzanne testing? • A. She is testing the Amount of light. www.mediatinker.com
This scientist is studying the affects of fertilizer. Is this a good experimental set up? NO What is wrong with this experimental design? How can we change this to make it correct? Per day10 ml H2O 2 g fertilizer 3 hrs sunlight Per day15 ml H2O 5 g fertilizer 6 hrs sunlight Per day20 ml H2O 10 g fertilizer 4 hrs sunlight 10 10 0 3 3
Repeated observation and experimentation may result in a challenge to a hypothesis. Challenges may be successful; thus, science is self-correcting. Science does not include hypotheses that are not testable. Concepts that are not testable following the scientific method are not necessarily incorrect; however, they cannot be considered scientific. weirdscience.ca
Scientists report their findings: • publish it in scientific magazines/journals • report it to other scientists • provide findings to the scientific community for scrutiny Common Ways to Present Information: • Chart/Table = summarizes data • Diagram/Model = explains or shows detail • Bar Graph = shows magnitude of data • Line Graph = relates two sets of data; shows how data changes • Circle Graph = relates parts of a whole • Flowchart = shows the order of steps • Scatter Plot = shows relationship between sets of data Goal 1 Graphs PPT
Bias = a predisposition to a particular idea or conclusion. • Examples: • A principal working to determine the most nutritious school menu would not get an unbiased response if he only asked 5 year olds. • A congressman searching for information about the humane treatment of animals would not gather accurate data if she only asked animal rights activists. • Scientists must guard against bias as they do their work.They must be careful that their sample is not biased and not to read their data with bias (seeing what they want to see instead of what is truly represented).
Sample Size= group of a population that is being studied. TOO SMALL GOOD SAMPLE SIZE POPULATION
Terminology Scientific Research Inference = deduction based on observations and prior knowledge. Professor NowitAhl observes fish dying in lakes near a power plant. He infers that some factory by-product is making the fish sick.
Conclusion = statement that explains the relationship between the variables of an experiment. Professor NowitAhl conducts an experiment to identify the source of the sickness in the fish. He concludes that the fish were becoming sick from the hot water being dumped into the naturally cool water.
Prediction = a statement suggesting what might happen in the future (based on patterns in data and experiences). Professor NowitAhl looks at his data and sees that the hotter the water became, the sicker the fish became. He predicts that the fish will become even sicker or may even die if the water gets too hot.
Extrapolation = a process used to make predictions about other circumstances that were not tested in the experiment. Professor NowitAhl prepares the following graph… Although the Professor didn’t continue his data beyond 40oF, he can extrapolate that if the temperature went up to 70oF, 150 fish would be sick. Number of Sick Fish 0 50 100 150 200 0 10 20 30 40 50 60 70 Temperature (oF)
Practice Question: • A scientist is investigating how the color of a flower affects the frequency of pollination by honey bees. She takes data showing the color of the flower and the number of bees that pollinate it in one 8-hour day. Based on her data, she determines that yellow flowers are pollinated more often. What type of statement does this represent? • a conclusion • an inference • a hypothesis • a prediction Click to show correct answer.
Model = a comprehensive explanation for an observation Illustrations Computer simulations 3d models Mathematical descriptions
A good model must… … explain ALL observations. … be able to be used to make PREDICTIONS. … make sense when related to known scientific processes. A good model can… … change over time as new information is learned. … can become theories if they are proven correct again and again.
What is the difference between Science and Biology? Science is the study of the natural world around us. Biology is the study of the living part of that natural world. Biology is the study of life. Why do you need to know about life? Because you are alive and you exist in a living world. How do you know you are alive?
Seven Characteristics of Life • A species must have ALL SEVEN to be considered living. • Order • All organisms within a species exhibit complex organization • Regulation • Maintenance of homeostasis (internal environment) • 3. Growth and Development • Pattern of growth and development for each organism • Energy utilization • All organisms take in energy and transform it for use • Response to the environment • All organisms respond to their environment • Reproduction capabilities • All species can reproduce themselves • Evolution • All species evolve (change over time)
Unity and Diversity There is great Diversity of living things. Example: One Four-Square Mile patch of Rainforest contains… 400 species of birds 1500 species of flowering plants 60 species of reptiles 750 species of trees 125 species of mammals flickr.com 150 species of butterflies 60 species of amphibians s297.photobucket.com www.panamacanal.com www.ourcommunity.com.au image59.webshots.com
To make sense of the diverse life forms in the world (or even in a smaller complicated system like the rainforest) it helps to organize the organisms. A three-domain system of classification allows biologists to group organisms using structure/function and DNA/RNA Sequencing. The three domains can be divided into two (2) groups: Cells without a nucleus Cells with a nucleus NONUCLEUS library.thinkquest.org biology.clc.uc.edu prokaryote.com faculty.irsc.edu
The Three Domains: 1. Domain Bacteria Includes Eubacteria (true bacteria). Description: Unicellular prokaryotes. www.scharfphoto.com Bacteria that causes Strep throat illness. www.blog.thesietch.org shelbyjonas.glogster.com
The Three Domains: 2. Domain Archaea Includes Arachaebacteria (ancient bacteria). Description: Extreme thermophiles and methanogens. (thermophiles live in very hot places) (methanogens live in methane suffocated places) Have characteristics of both Bacteria and Eukarya. microbezoo.commtechlab.msu.edu www.erdc.usace.army.mil www.naturalsciences.org
3. Domain Eukarya Kingdom Protista (unicellular and multicellular microorganisms) Kingdom Fungi (multicellular mushrooms, molds, mildews) Kingdom Plantae (all plants) Kingdom Animalia (all animals) Amoeba Paramecia www-biology.ucsd.edu facultyfp.salisbury.edu Mushroom Bread mold www.williamsclass.com upload.wikimedia.org piedpatter.files.wordpress.com Venus Fly Trap www.pdphoto.org www.monkeymania.co.uk
There is Unity within this great diversity of living things. This unity exists in ALL living things and provides evidence of our relationships with each other. Cells of all species contain many of the same molecules like DNA. The DNA of all species is coded in the same way. (Note that the differences between species are a result of differences in the sequence (order) of the DNA.)
What is a THEORY? • An idea. • A really good idea. • A good idea from a scientist. tvtropes.org www.toothpastefordinner.com • An idea that explains something specific. • A widely accepted answer that explains a process and is supported by lots of evidence. scienceblogs.com
What theory can explain the great diversity of organisms on earth and also explain the unity among all that diversity at the same time? EVOLUTION Explains both unity and diversity of life on earth. Because all living organisms have a common ancestor, we are all UNIFIED. Becauseall living organisms have evolved over time, we are all DIVERSE. Want a hint? larvalsubjects.files.wordpress.com
Another theory that explains the process of evolution… NATURAL SELECTION Certain heritable characteristics (or adaptations) are favored over others when put to the test out in the real world environment. Brain capacity wasn’t the only characteristic that allowed humans to surge up the evolutionary ladder. Opposable thumbs provided a serious advantage! amnh.org The opposable thumb was an adaptation that was favored by the environment in which early humans lived.
Perform the following activities as instructed using the materials provided: • Open the jar and pour the contents onto your desk. • Pick up the penny and place it inside the ziplock bag. Close the bag. • Stick the tack into the cardboard then remove it. • Write your name in the center of the paper. • Now cut your name out of the paper. • Paperclip the cut piece of paper (with your name) to the remaining piece of paper. • Staple the paper-clipped papers to a sheet of notebook paper. • Remove the paperclip and place the stapled papers into the homework box. This will insure you receive an activity grade. • Open the door to the work room then close it back gently. • Place the tack, the penny and the paper clip into the plastic jar. Tape both of your thumbs to your hands like this… clker.com You may need a partner to help you tape your thumbs.
Living organisms form interconnecting webs with their environments. Could this bubble boy survive alone in the wild? Why NOT? Because he cannot interact with his environment! What non-living resources does he need? What living resources does he need? treklens.com
Plants and some algae use sunlight, water, and carbon dioxide to perform photosynthesis and make food for themselves and for all other life forms. Energy for all life forms begins with the sun and the process of photosynthesis. All organisms ultimately depend on autotrophs (plants) for food. (Why?) www.rock-hill.k12.sc.us
Autotrophs (plants) take in the energy from the sun to start it in the cycle of nutrients for all organisms. Once the energy has been consumed and passes through a sequence of living organisms it is broken down into non-living nutrients that enter the soil (nitrogen, carbon, phosphorus, etc.) and are then available to be used by new autotrophs who begin the cycle again. www.sheppardsoftware.com The organisms that return the energy components to the soil are called decomposers.
Learning to Read a Question: Refer to Figure 1.7A on page 10. Discuss how photosynthesis of the rainforest plants functions in both the cycling of carbon and the flow of energy in a rainforest ecosystem. What are you being asked to discuss? Analyze the figure. Now answer the discussion question.
BIOTECHNOLOGY = the practical application of scientific biological knowledge www.theage.com.au a1biotech.biz sushantshukla.wordpress.com www.labnews.co.uk
BIOLOGY IS CONNECTED TO OUR LIVES IN MANY WAYS Biodiversity Birth Death Human Population Pollution Environmental Changes Agriculture YOU Medical Concerns Nutrition Exercise Diet Endangered Species k53.pbase.com
Assignment: Textbook: pg 13-14 #1-10 Coach: L1, L2, L3, L4, and L6 AnyQuestions?