Download
1 / 26
260 likes | 414 Vues
Aquarius Mission Surface Salinity from Space. Gary Lagerloef , Principal Investigator Yi Chao , Project Scientist Eric Lindstrom , NASA Program Scientist Eric Ianson , NASA Program Executive. What this Briefing Covers. What ocean salinity is

E N D
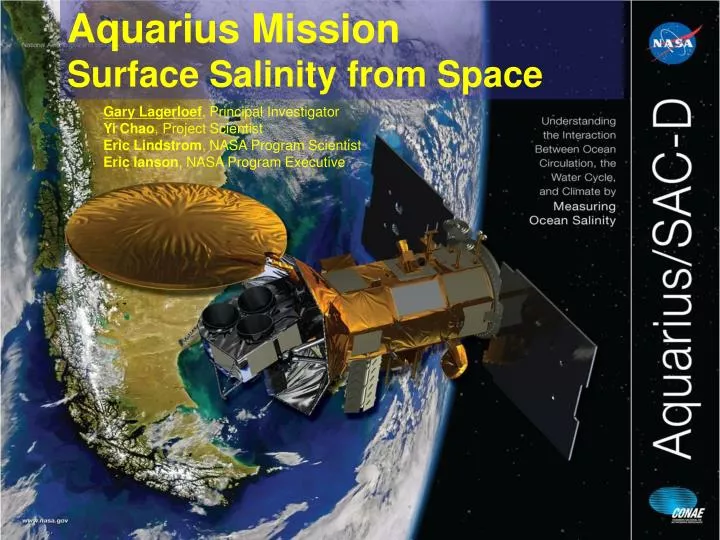
Aquarius Mission Surface Salinity from Space Gary Lagerloef, Principal Investigator Yi Chao, Project Scientist Eric Lindstrom, NASA Program Scientist Eric Ianson, NASA Program Executive
What this Briefing Covers • What ocean salinity is • Why it is important to measure it from satellite • How we will measure it with the Aquarius mission • Who is participating in the mission • More information about the mission
Project Overview • Features • Principal Measurement: Sea Surface Salinity • Coverage: Ice-free ocean; every 150 km (93 mi); monthly • Science: Ocean Circulation, Water Cycle, Climate • Launch Date: June 9, 2011, VAFB, California (Delta-II) • Minimum Operational Life: 3 years • NASA Earth System Science Pathfinder (ESSP) Mission • United States – Argentina Partnership • Science • Observe seasonal and year-to-year sea surface salinity variations • Investigate links between the water cycle, ocean circulation and climate • Improve ocean models and climate prediction models Aquarius/SAC-D is presently at the Laboratory for Integration and Test (LIT) in Brazil
What will Aquarius measure? Sea Surface Salinity Salt Concentration: grams of dissolved salt per kilogram of sea water Average surface salinity is 35, range is 32 to 37 Salinity is now measured by electrical conductivity using a “practical salinity scale” Often we refer to “practical salinity units” (psu), equivalent to grams per kilogram Salinity map from historical ship and buoy data Mean = 35 psu Aquarius Accuracy = 0.2 psu
The Earth’s Water Cycle Ocean Salinity and the Global Water Cycle Global salinity patterns are linked to rainfall and evaporation Salinity variations are driven by precipitation, evaporation, runoff and ice freezing and melting The Atlantic is the saltiest ocean due to excess evaporation Sea Surface Salinity
Aquarius Mission Science Salinity Links to Ocean Circulation and Climate Salinity (along with temperature and therefore density) drives the ocean circulation, known as the great conveyor belt.
Aquarius Accuracy • Aquarius will detect small salinity changes • of just 0.2 psu (2 parts in 10,000) • over a month’s time • over a 150 km (93 mile) square patch of ocean 0.2 psu change is the same as adding 1/8 tsp of salt to a gallon of seawater.
Salinity, the Missing Piece Satellites already measure surface temperature, solar energy, rainfall, evaporation, sea level, surface wind, to infer ocean circulation, and ocean color Aquarius provides the key variable that links ocean currents and temperature to the fresh water cycle.
How Aquarius Measures Salinity Salinity is determined from microwave brightness temperature and sea surface temperature measurements Brightness temperature variations are very small Sea Surface Temperature (Celsius) • The Aquarius instrument design required innovative new technologies • Ultra stable calibration (0.1 Kelvin) • Integrated microwave radiometer and radar to correct for sea surface roughness
Mission Design and Sampling Strategy Sun-synchronous exact repeat orbit 6pm ascending node Altitude 657 km • Global Coverage in 7 Days • 4 Repeat Cycles per Month Beams point toward the night side to avoid sun glint In Orbit Checkout 3 beams390 km wide swath. 76 x 94 km 96 x 156 km Aquarius will collect as much data during the first few months of the mission as all previous conventional ship and buoy measurements. 84 x 120 km Launch
Aquarius 150 km Resolution Argo Buoys Aquarius “Filter” 150-km Unfiltered minus 150-km Filter HYCOM 12-km January 2010 Courtesy Y. Chao, JPL
International Partnership Satellite Observatory United States – Argentina and other agencies • Service Platform and SAC-D (Satélite de Aplicaciones Cientificas) Science Instruments • Mission Operations & Ground System • Aquarius Salinity Microwave Instrument (Instrument Ops + Science Data Processing) • Launch Vehicle
Aquarius will address the links between ocean circulation, the global water cycle and climate Aquarius’ sea surface salinity will provide a key missing link in satellite Earth observations Aquarius applies innovative new instrument technologies to obtain unprecedented measurement accuracy
Water Cycle, Ocean and Climate Water Cycle (rainfall (78%), evaporation (85%), rivers, ice freeze/melt) Salinity Density Ocean Circulation Ocean heat transport and exchange with the Atmosphere Water Cycle and we need to map the sea surface salinity variability over the whole ocean in order to understand these interactions. Coupled System
Aquarius Mission Science Salinity Links to Ocean Circulation and Climate. Salinity (along with temperature and therefore density) drives the ocean circulation, known as the great conveyor belt.
Ocean Salinity Trends; Links to Water Cycle Gordon and Giulivi, Oceanography, 21 (1), 2008 M. Latif, GRL 2001 1950 2000
Steps in Science Retrieval In addition to the surface ‘flat sea’ emission, we must account for corrections due to the sky, atmosphere, ionosphere, land and ice, and especially surface roughness.
Salinity Remote Sensing – The Basics Salinity is Derived by Measuring Brightness Temperature at L-Band (1.413 GHz) Microwave radiometers measure the emitted power of a surface in terms of a parameter called the radiometric brightness temperature (TB), which is proportional to the ideal black body radiation. TB is the product of emissivity (e) and absolute surface temperature (T) in Kelvins TB=eT, where e~0.3 for seawater e is a function of, incidence angle θ, polarization H or V, sea state and the dielectric coefficient ε. εdepends on S, T, and radio frequency (f) Klein & Swift (1977) dielectric model at microwave frequencies Sensitivity increases with SST
Resources for More Information Oceanography Special Issue March 2008
Relevance to National Research Programs “The National Aeronautics and Space Administration (NASA) has confirmed the development of the Aquarius instrument, which will be onboard Argentina's Satélite de Aplicaciones Científicas-D (SAC-D) satellite …. “ U.S. Ocean Action Plan Implementation Update, January 2007; Committee on Ocean Policy “The launch of Aquarius/SAC-D, as well as improvements meteorological observing systems and models, offers the scientific community a unique opportunity to step beyond monitoring and to attempt to constrain the complete surface atmosphere/ocean hydrologic cycle based on observations.” US CLIVAR Salinity Working Group Report, June 2007 Aquarius science addresses NASA’s Earth Science Research Strategy and is vetted through the NASAESSP selection process (ESSP-03): Earth System Variability and Trends: How are global precipitation, evaporation, and the cycling of water changing? Earth System Responses and Feedback Processes: How can climate variations induce changes in the global ocean circulation? “Aquarius is a satellite mission to measure global sea surface salinity. …over the global oceans to a precision of 2 parts in 10,000. Aquarius will answer long-standing questions about how our oceans respond to climate change and the water cycle, including changes in freshwater input and output to the ocean associated with precipitation, evaporation, ice melting, and river runoff. These activities will address Goals 12.1 and 12.5 of the CCSP Strategic Plan.” U.S. Climate Change Science Program for FY-2007
Observatory Configuration Y Anti-Sun Z Nadir XFLT DIR Deployed Configuration Stowed Configuration Aquarius Reflector Aquarius Instrument Delta 7320-10 C Fairing Station location in mm SAC-D Station 4922.0 AQ Station 2382.0 Aquarius Sunshade ROSA SAC-D Service Platform SAC-D Station 2540.0 AQ Station 0.0 NIRST Star Trackers Solar Panel HSC Comm. Antennas MWR Nav-GPS, ROSA, TDP and s-Band Antennas SAC-D Station 0.0 CARMEN-1 (SODAD 1 of 3)
Specific measurements • Global sea surface salinity measurements (Aquarius). • Soil moisture (Aquarius). • Measurements of precipitable water, sea ice concentration and sea surface wind speed (which will enhance the results of Aquarius measurements) (Microwave Radiometer-MWR). • Measurements of water vapor, cloud liquid water. (Microwave Radiometer-MWR). • Monitoring of hot spots caused by biomass fires and volcanic eruptions, estimation of fire radiative power (NIRST). • Measurements of sea surface temperature (which also will enhance the results of Aquarius measurements in pilot areas) (NIRST).
Specific measurements • Measurements of light intensity (urban areas, detection of electric storms, snow coverage, sea surveillance and aurora studies) (HSC). • Measurements of atmospheric temperature, pressure profiles, and water vapor content (ROSA). • Measure the high energy radiation environment (ICARE). • Measure the size distribution of micro- particles and space debris (SODAD). • Collect environmental measured parameters (e.g. meteorological) (DCS)