Download

1 / 17
170 likes | 173 Vues
NATIONAL AVERAGE. Yuri Dikhanov. LOCATION HIERARCHY. TOOLPACK STRUCTURE. PAM. interface. TCP/IP. PCMs. PC1. PC1. PC1. REGION-COUNTRIES DATA FLOW. REGIONAL PAM. AVG. DATA. AVG. DATA. RAW DATA. RAW DATA. COUNTRY PAMs. CASE 1. Simple self-weighting (no spatial hierarchy).

E N D
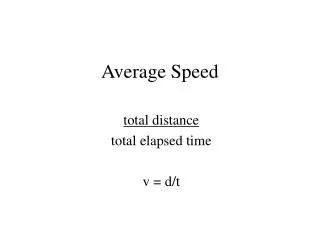
NATIONAL AVERAGE • Yuri Dikhanov
LOCATION HIERARCHY TOOLPACK STRUCTURE PAM interface TCP/IP PCMs PC1 PC1 PC1
REGION-COUNTRIES DATA FLOW REGIONAL PAM AVG. DATA AVG. DATA RAW DATA RAW DATA COUNTRY PAMs
Weights changing over the yearEach outlet has to have a separate system of weights
Various averaging methods (arithmetic mean – default, other are possible) • Next release will incorporate 3D processing for quarters (beginning of 2005)
National coverage: • Self-weighting sampling: each region/market segment is sampled proportionally to its size. No adjustments/weights necessary. ICP Toolpack will produce the national average; • Non-self-weighting sampling [see Chapter 6 on sampling]: each region/market segment is assigned a weight. Regional averages will be computed in the Toolpack. Computation of the national average out of the regional averages will be done in the Toolpack as a weighted arithmetic mean of regional prices[1]; • [1] ICP Toolpack has the ability to compute the averages as it allows uploading the expenditure weights [consult ICP Toolpack Operation Manual].
Selective coverage: • Capital city, selective other areas: the areas other than capital cities should be given weights to make them representative of their markets. For example, if only three other provinces participate in the comparison then each province should be given weight of the region where it belongs to. Regional averages will be computed in the Toolpack. Computation of the national average will be done in the Toolpack, as a weighted arithmetic mean of regional prices. • Capital city only, no other areas: it is impossible to estimate the national average price in this case. An effort needs to be made to incorporate at least some prices from other markets. Even when the capital city is responsible for the majority of sales in the country, price level of certain commodities, such as foods, in the countryside maybe different enough to significantly influence the national average price level.