Download
1 / 8
190 likes | 543 Vues
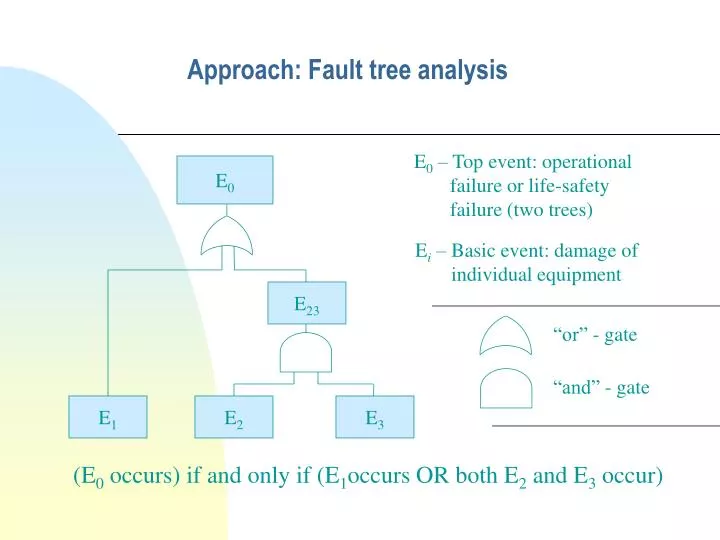
Approach: Fault tree analysis. E 0 – Top event: operational failure or life-safety failure (two trees). E 0. E i – Basic event: damage of individual equipment. E 23. “or” - gate. “and” - gate. E 1. E 2. E 3. (E 0 occurs) if and only if (E 1 occurs OR both E 2 and E 3 occur). E 0.

E N D
Approach: Fault tree analysis E0 – Top event: operational failure or life-safety failure (two trees) E0 Ei – Basic event: damage of individual equipment E23 “or” - gate “and” - gate E1 E2 E3 (E0 occurs) if and only if (E1occurs OR both E2 and E3 occur)
E0 E23 E1 E2 E3 Fault tree analysis (continued) Mathematical equivalent of gates (independent events): O I1 IN O IN I1 For the example fault tree:
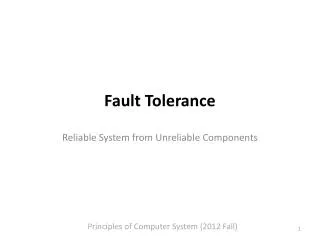
Decision variables and top-event definitions Events of interest and proposed Decision Variables (DV): • Life safety failure: DVLS=P(LSF | T), where LSF is • Occurrence of a life-threatening event, T = planning period (alternatively: DVLS=P(LSF|IM)) • Operational Failure: DVO=P(OF | T) or P(OF | IM), where OF is • Repair or replacement time of critical equipment exceeds some threshold value DT0. • Research products lost and the time to repeat the study is greater than some threshold value RT0. Required performance level is specified by DVLS, DVO, DT0, RT0
Fault tree illustration for an LSA laboratory Operational Failure To be refined upon consulting Comerio’s database, Comerio and LSA occupants Subject Die Critical Equipment Failure Data Lost Env. Failure Trauma Microscope is broken Data storage device is broken Temp. Changes Containment Failure Basic event (Damage State) Hazmat Release Tube is broken
Expected Results • Result of calculation of DV=P(E0 | IM) by applying theorem of total probability • Result of calculation of DV=P(E0 | EDP) 1.0 1.0 DV DV 0.0 0.0 x1 x2 x3 x1 x2 x3 IM IM Each point corresponds to a particular value of the vector of EDP at the given level of IM Where N – is number of simulations at the level IM=xi, and the right part probabilities are all conditioned on IM= xi
What we would like from structure modeler (Mosalam) GM ID SIM # EDP ID EDP Value Files in formats: CSV, MDB, XLS.
What we would like from fragility testers Fragility Parameters DS Assembly ID Assembly Name EDP Type P1 (e.g. ) P2 (e.g. ) Files in formats: CSV, MDB, XLS.
Expected Results (Simulation Technique) • Result of simulation of E0| EDP, using generated El events • P(E0 | EDP), using generated El events 1.0 E0 DV n1 n2 m3 n3 m2 m1 0.0 x1 x2 x3 x1 x2 x3 IM IM • Generate basic event Eiaccording to distribution P(El | EDP = Vk) • Follow Boolean logic of the fault tree to know if E0has happened • Repeat for all Vk , and get ni, mi for each level of excitation IM=xi Where mi – is number of simulations when E0 has happened, and ni – is number of simulations when E0 has not happened