Download
1 / 1
10 likes | 120 Vues
Operational instruments [and measured parameters] Meteorological station [air pressure, temperature, humidity, wind direction and velocity, precipitation (Vaisala); solar irradiance (Kipp and Zonen)]. SODAR [wind vertical profiles, three components, ERSE].

E N D
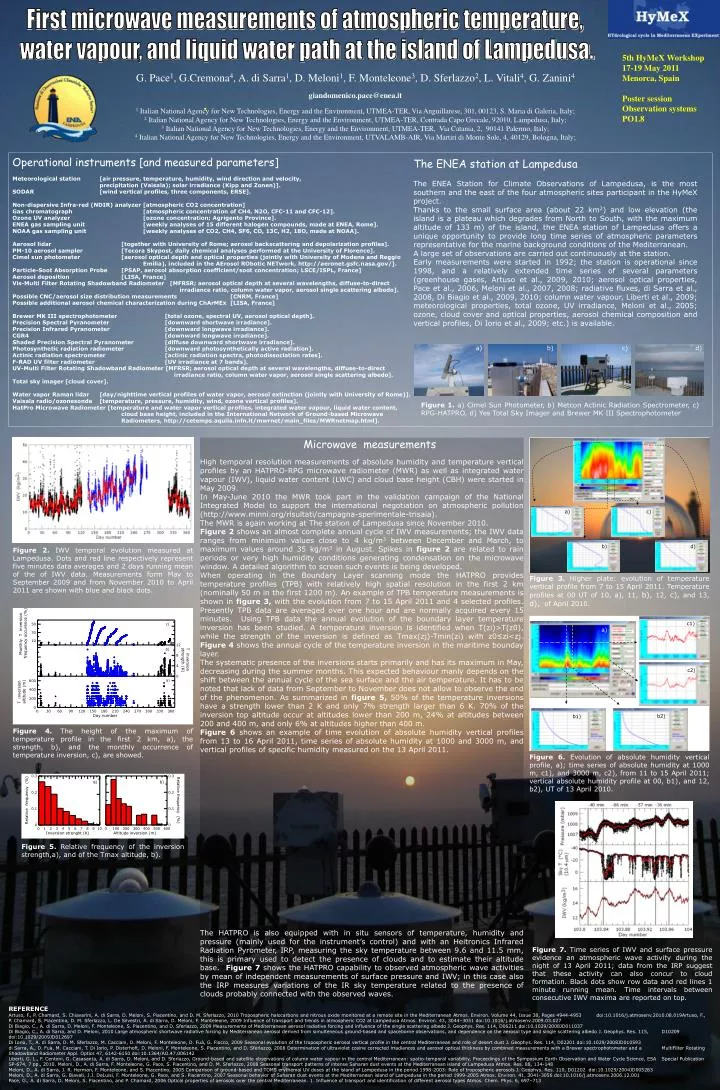
Operational instruments [and measured parameters] Meteorological station [air pressure, temperature, humidity, wind direction and velocity, precipitation (Vaisala); solar irradiance (Kipp and Zonen)]. SODAR [wind vertical profiles, three components, ERSE]. Non-dispersive Infra-red (NDIR) analyzer [atmospheric CO2 concentration] Gas chromatograph [atmospheric concentration of CH4, N2O, CFC-11 and CFC-12]. Ozone UV analyzer [ozone concentration; Agrigento Province]. ENEA gas sampling unit [weekly analyses of 15 different halogen compounds, made at ENEA, Rome]. NOAA gas sampling unit [weekly analyses of CO2, CH4, SF6, CO, 13C, H2, 18O, made at NOAA]. Aerosol lidar [together with University of Rome; aerosol backscattering and depolarization profiles]. PM-10 aerosol sampler [Tecora Skypost, daily chemical analyses performed at the University of Florence]. Cimel sun photometer [aerosol optical depth and optical properties (jointly with University of Modena and Reggio Emilia), included in the AErosol RObotic NETwork, http://aeronet.gsfc.nasa.gov/]. Particle-Soot Absorption Probe [PSAP, aerosol absorption coefficient/soot concentration; LSCE/ISPL, France] Aerosol deposition [LISA, France] Vis-Multi Filter Rotating Shadowband Radiometer [MFRSR; aerosol optical depth at several wavelengths, diffuse-to-direct irradiance ratio, column water vapor, aerosol single scattering albedo]. Possible CNC/aerosol size distribution measurements [CNRM, France] Possible additional aerosol chemical characterization during ChArMEx [LISA, France] Brewer MK III spectrophotometer [total ozone, spectral UV, aerosol optical depth]. Precision Spectral Pyranometer [downward shortwave irradiance]. Precision Infrared Pyranometer [downward longwave irradiance]. CGR4 [downward longwave irradiance]. Shaded Precision Spectral Pyranometer [diffuse downward shortwave irradiance]. Photosynthetic radiation radiometer [downward photosynthetically active radiation]. Actinic radiation spectrometer [actinic radiation spectra, photodissociation rates]. F-RAD UV filter radiometer [UV irradiance at 7 bands]. UV-Multi Filter Rotating Shadowband Radiometer [MFRSR; aerosol optical depth at several wavelengths, diffuse-to-direct irradiance ratio, column water vapor, aerosol single scattering albedo]. Total sky imager [cloud cover]. Water vapor Raman lidar [day/nighttime vertical profiles of water vapor, aerosol extinction (jointly with University of Rome)]. Vaisala radio/ozonesonde [temperature, pressure, humidity, wind, ozone vertical profiles]. HatPro Microwave Radiometer [temperature and water vapor vertical profiles, integrated water vapour, liquid water content, cloud base height, included in the International Network of Ground-based Microwave Radiometers, http://cetemps.aquila.infn.it/mwrnet/main_files/MWRnetmap.html]. The ENEA station at Lampedusa The ENEA Station for Climate Observations of Lampedusa, is the most southern and the east of the four atmospheric sites participant in the HyMeX project. Thanks to the small surface area (about 22 km2) and low elevation (the island is a plateau which degrades from North to South, with the maximum altitude of 133 m) of the island, the ENEA station of Lampedusa offers a unique opportunity to provide long time series of atmospheric parameters representative for the marine background conditions of the Mediterranean. A large set of observations are carried out continuously at the station. Early measurements were started in 1992; the station is operational since 1998, and a relatively extended time series of several parameters (greenhouse gases, Artuso et al., 2009, 2010; aerosol optical properties, Pace et al., 2006, Meloni et al., 2007, 2008; radiative fluxes, di Sarra et al., 2008, Di Biagio et al., 2009, 2010; column water vapour, Liberti et al., 2009; meteorological properties, total ozone, UV irradiance, Meloni et al., 2005; ozone, cloud cover and optical properties, aerosol chemical composition and vertical profiles, Di Iorio et al., 2009; etc.) is available. Figure 1. a) Cimel Sun Photometer, b) Metcon Actinic Radiation Spectrometer, c) RPG-HATPRO, d) Yes Total Sky Imager and Brewer MK III Spectrophotometer a) b) c) d) First microwave measurements of atmospheric temperature, water vapour, and liquid water path at the island of Lampedusa. 5th HyMeX Workshop 17-19 May 2011 Menorca, Spain Poster session Observation systems PO1.8 G. Pace1, G.Cremona4, A. di Sarra1, D. Meloni1, F. Monteleone3, D. Sferlazzo2, L. Vitali4, G. Zanini4 giandomenico.pace@enea.it 1 Italian National Agency for New Technologies, Energy and the Environment, UTMEA-TER, Via Anguillarese, 301, 00123, S. Maria di Galeria, Italy; 2 Italian National Agency for New Technologies, Energy and the Environment, UTMEA-TER, Contrada Capo Grecale, 92010, Lampedusa, Italy; 3 Italian National Agency for New Technologies, Energy and the Environment, UTMEA-TER, Via Catania, 2, 90141 Palermo, Italy; 4 Italian National Agency for New Technologies, Energy and the Environment, UTVALAMB-AIR, Via Martiri di Monte Sole, 4, 40129, Bologna, Italy; Microwave measurements High temporal resolution measurements of absolute humidity and temperature vertical profiles by an HATPRO-RPG microwave radiometer (MWR) as well as integrated water vapour (IWV), liquid water content (LWC) and cloud base height (CBH) were started in May 2009. In May-June 2010 the MWR took part in the validation campaign of the National Integrated Model to support the international negotiation on atmospheric pollution (http://www.minni.org/risultati/campagna-sperimentale-trisaia). The MWR is again working at The station of Lampedusa since November 2010. Figure 2 shows an almost complete annual cycle of IWV measurements; the IWV data ranges from minimum values close to 4 kg/m3 between December and March, to maximum values around 35 kg/m3 in August. Spikes in figure 2 are related to rain periods or very high humidity conditions generating condensation on the microwave window. A detailed algorithm to screen such events is being developed. When operating in the Boundary Layer scanning mode the HATPRO provides temperature profiles (TPB) with relatively high spatial resolution in the first 2 km (nominally 50 m in the first 1200 m). An example of TPB temperature measurements is shown in figure 3, with the evolution from 7 to 15 April 2011 and 4 selected profiles. Presently TPB data are averaged over one hour and are normally acquired every 15 minutes. Using TPB data the annual evolution of the boundary layer temperature inversion has been studied. A temperature inversion is identified when T(zi)>T(z0), while the strength of the inversion is defined as Tmax(zj)-Tmin(zi) with z0≤zi<zj. Figure 4 shows the annual cycle of the temperature inversion in the maritime bounday layer. The systematic presence of the inversions starts primarily and has its maximum in May, decreasing during the summer months. This expected behaviour manly depends on the shift between the annual cycle of the sea surface and the air temperature. It has to be noted that lack of data from September to November does not allow to observe the end of the phenomenon. As summarized in figure 5, 50% of the temperature inversions have a strength lower than 2 K and only 7% strength larger than 6 K. 70% of the inversion top altitude occur at altitudes lower than 200 m, 24% at altitudes between 200 and 400 m, and only 6% at altitudes higher than 400 m. Figure 6 shows an example of time evolution of absolute humidity vertical profiles from 13 to 16 April 2011, time series of absolute humidity at 1000 and 3000 m, and vertical profiles of specific humidity measured on the 13 April 2011. The HATPRO is also equipped with in situ sensors of temperature, humidity and pressure (mainly used for the instrument’s control) and with an Heitronics Infrared Radiation Pyrometer, IRP, measuring the sky temperature between 9.6 and 11.5 mm, this is primary used to detect the presence of clouds and to estimate their altitude base. Figure 7 shows the HATPRO capability to observed atmospheric wave activities by mean of independent measurements of surface pressure and IWV; in this case also the IRP measures variations of the IR sky temperature related to the presence of clouds probably connected with the observed waves. Figure 2.IWV temporal evolution measured at Lampedusa. Dots and red line respectivelyrepresent five minutes data averages and 2 days running mean of the of IWV data. Measurements form May to September 2009 and from November 2010 to April 2011 are shown with blue and black dots. Figure 3. Higher plate: evolution of temperature vertical profile from 7 to 15 April 2011. Temperature profiles at 00 UT of 10, a), 11,b), 12,c), and 13,d), of April 2010. Figure 4.The height of the maximum of temperature profile in the first 2 km, a), the strength, b), and the monthly occurrence of temperature inversion, c), are showed. Figure 6. Evolution of absolute humidity vertical profile, a); time series of absolute humidity at 1000 m, c1), and 3000 m, c2), from 11 to 15 April 2011; vertical absolute humidity profile at 00, b1), and 12, b2), UT of 13 April 2010. Figure 5.Relative frequency of the inversion strength,a), and of the Tmax altitude, b). Figure 7. Time series of IWV and surface pressure evidence an atmospheric wave activity during the night of 13 April 2011; data from the IRP suggest that these activity can also concur to cloud formation. Black dots show row data and red lines 1 minute running mean. Time intervals between consecutive IWV maxima are reported on top. REFERENCE Artuso, F., P. Chamard, S. Chiavarini, A. di Sarra, D. Meloni, S. Piacentino, and D. M. Sferlazzo, 2010 Tropospheric halocarbons and nitrous oxide monitored at a remote site in the Mediterranean Atmos. Environ. Volume 44, Issue 38, Pages 4944-4953 doi:10.1016/j.atmosenv.2010.08.019Artuso, F., P. Chamard, S. Piacentino, D. M. Sferlazzo, L. De Silvestri, A. di Sarra, D. Meloni, F. Monteleone, 2009 Influence of transport and trends in atmospheric CO2 at Lampedusa Atmos. Environ. 43, 3044–3051 doi:10.1016/j.atmosenv.2009.03.027 Di Biagio, C., A. di Sarra, D. Meloni, F. Monteleone, S. Piacentino, and D. Sferlazzo, 2009 Measurements of Mediterranean aerosol radiative forcing and influence of the single scattering albedo J. Geophys. Res. 114, D06211 doi:10.1029/2008JD011037 Di Biagio, C., A. di Sarra, and D. Meloni, 2010 Large atmospheric shortwave radiative forcing by Mediterranean aerosol derived from simulteneous ground-based and spaceborne observations, and dependence on the aerosol type and single scattering albedo J. Geophys. Res. 115, D10209 doi:10.1029/2009JD012697 Di Iorio, T., A. di Sarra, D. M. Sferlazzo, M. Cacciani, D. Meloni, F. Monteleone, D. Fuà, G. Fiocco, 2009 Seasonal evolution of the tropospheric aerosol vertical profile in the central Mediterranean and role of desert dust J. Geophys. Res. 114, D02201 doi:10.1029/2008JD010593 di Sarra, A., D. Fuà, M. Cacciani, T. Di Iorio, P. Disterhoft, D. Meloni, F. Monteleone, S. Piacentino, and D. Sferlazzo, 2008 Determination of ultraviolet cosine corrected irradiances and aerosol optical thickness by combined measurements with a Brewer spectrophotometer and a MultiFilter Rotating Shadowband Radiometer Appl. Optics 47, 6142-6150 doi:10.1364/AO.47.006142 Liberti, G. L., F. Centoni, G. Casasanta, A. di Sarra, D. Meloni, and D. Sferlazzo, Ground-based and satellite observations of column water vapour in the central Mediterranean: spatio-temporal variability, Proceedings of the Symposium Earth Observation and Water Cycle Science, ESA Special Publication SP-674, 7 pp., 2010. Meloni, D., A. di Sarra, F. Monteleone, G. Pace, S. Piacentino, and D. M. Sferlazzo, 2008 Seasonal transport patterns of intense Saharan dust events at the Mediterranean island of Lampedusa Atmos. Res. 88, 134-148 Meloni, D., A. di Sarra, J. R. Herman, F. Monteleone, and S. Piacentino, 2005 Comparison of ground-based and TOMS erythemal UV doses at the island of Lampedusa in the period 1998-2003: Role of tropospheric aerosols J. Geophys. Res. 110, D01202 doi:10.1029/2004JD005283 Meloni, D., A. di Sarra, G. Biavati, J.J. DeLuisi, F. Monteleone, G. Pace, and S. Piacentino, 2007 Seasonal behavior of Saharan dust events at the Mediterranean island of Lampedusa in the period 1999-2005 Atmos. Environ. 41, 3041-3056 doi:10.1016/j.atmosenv.2006.12.001 Pace, G., A. di Sarra, D. Meloni, S. Piacentino, and P. Chamard, 2006 Optical properties of aerosols over the central Mediterranean. 1. Influence of transport and identification of different aerosol types Atmos. Chem. Phys. 6, 697–713