Download
1 / 6
60 likes | 166 Vues
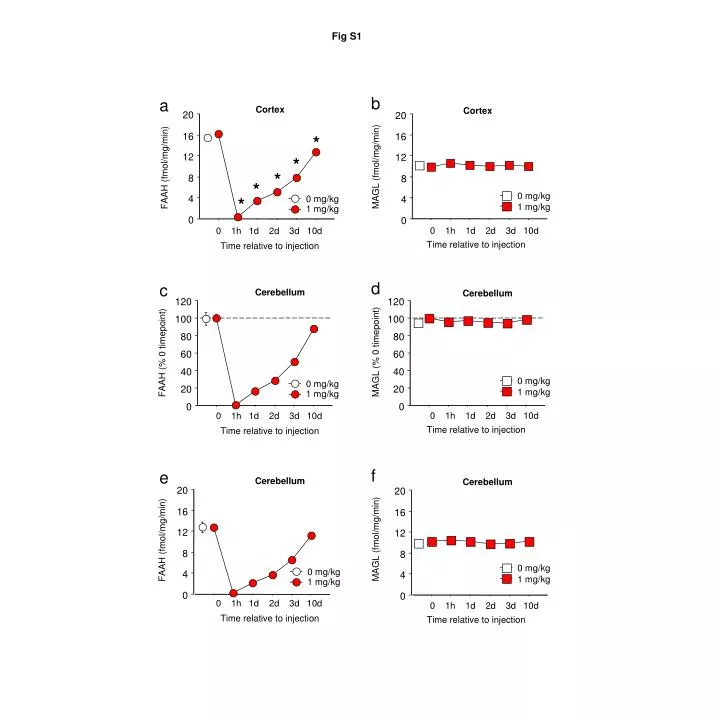
Fig S1. b. a. Cortex. Cortex. 20. 20. *. 16. 16. *. 12. 12. MAGL (fmol/mg/min). FAAH (fmol/mg/min). *. 8. 8. *. 0 mg/kg. *. 4. 4. 0 mg/kg. 1 mg/kg. 1 mg/kg. 0. 0. 0 1h 1d 2d 3d 10d. 0 1h 1d 2d 3d 10d. Time relative to injection.

E N D
Fig S1 b a Cortex Cortex 20 20 * 16 16 * 12 12 MAGL (fmol/mg/min) FAAH (fmol/mg/min) * 8 8 * 0 mg/kg * 4 4 0 mg/kg 1 mg/kg 1 mg/kg 0 0 0 1h 1d 2d 3d 10d 0 1h 1d 2d 3d 10d Time relative to injection Time relative to injection d c Cerebellum Cerebellum 120 120 100 100 80 80 MAGL (% 0 timepoint) FAAH (% 0 timepoint) 60 60 40 40 0 mg/kg 0 mg/kg 20 20 1 mg/kg 1 mg/kg 0 0 0 1h 1d 2d 3d 10d 0 1h 1d 2d 3d 10d Time relative to injection Time relative to injection f e Cerebellum Cerebellum 20 20 16 16 12 12 MAGL (fmol/mg/min) FAAH (fmol/mg/min) 8 8 0 mg/kg 0 mg/kg 4 4 1 mg/kg 1 mg/kg 0 0 0 1h 1d 2d 3d 10d 0 1h 1d 2d 3d 10d Time relative to injection Time relative to injection
Fig S2 a b VEH 0.5 mg/kg VEH 100 100 0.25 mg/kg 1.0 mg/kg AM 80 80 60 60 Percent freezing Percent freezing 40 40 20 20 0 0 Baseline Last trial-block Baseline Last trial-block First trial-block First trial-block c d VEH 100 100 AM 80 80 60 60 Percent freezing Percent freezing 40 40 20 20 0 0 AM VEH Baseline Last trial-block First trial-block
Fig S3 b a * * VEH 400 URB 400 AM 300 * 300 * AUC (mg h/dl) Glucose (mg/dl) 200 200 100 100 0 0 URB AM VEH 0 15 30 45 60 90 120 150 180 Time (min)
Fig S4 a b Amygdala Cortex Striatum 15 15 12 12 9 9 2-arachidonoylglycerol (pmol/mg protein) 2-arachidonoylglycerol (pmol/mg protein) 6 6 3 3 0 0 VEH AM VEH VEH AM AM CS CS CS CS CS CS CS-US CS-US CS-US CS-US CS-US CS-US
Fig S5 a b * AM3506 110 120 100 100 90 80 fEPSP amplitude (% baseline) fEPSP amplitude (% baseline) 80 60 70 40 60 20 50 0 0 20 30 40 50 60 70 80 90 100 Baseline Last 5 min Time (min) c d LFS 120 120 100 100 80 80 fEPSP amplitude (% baseline) 60 fEPSP amplitude (% baseline) 60 40 40 VEH 20 20 AM 0 0 -10 0 10 20 30 40 50 60 70 80 Base Last 5 Base Last 5 Time relative to LFS (min) VEH AM
Fig S6 a VEH 100 AM AM+SR SR 80 60 Percent freezing 40 20 0 Baseline Last trial-block First trial-block b VEH 100 AM AM+SRBLA 80 60 Percent freezing 40 20 0 Baseline Last trial-block First trial-block c VEH 100 AMBLA 80 60 Percent freezing 40 20 0 Baseline Last trial-block First trial-block


![[Fig. S1]](https://cdn3.slideserve.com/6448662/slide1-dt.jpg)


