Download
1 / 1
10 likes | 74 Vues
DATA ANALYSIS

E N D
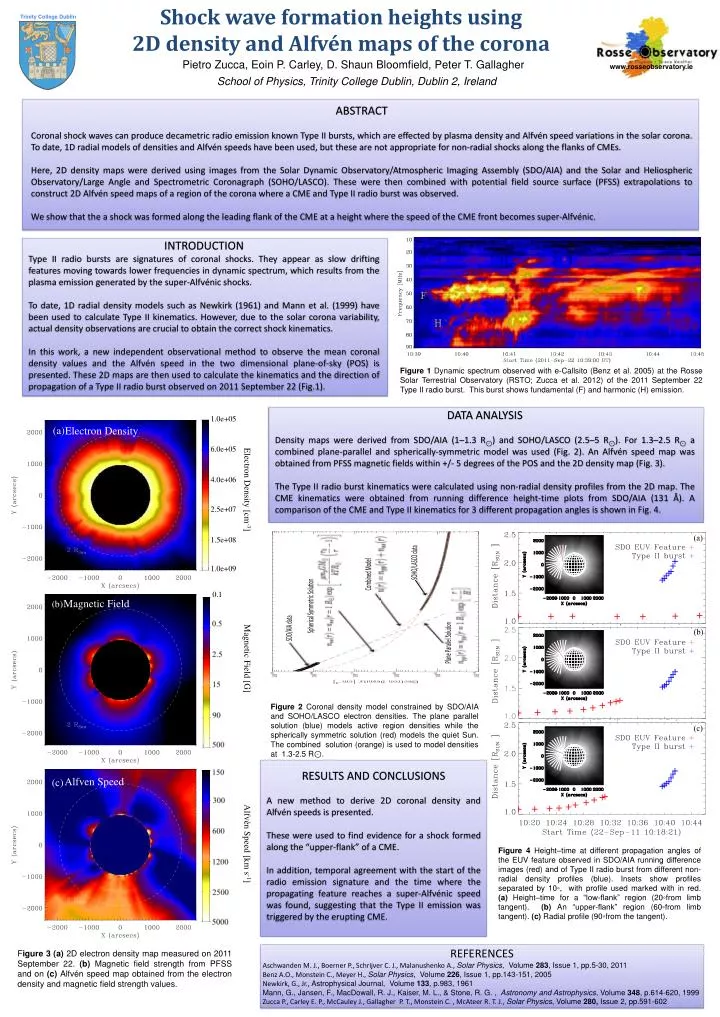
DATA ANALYSIS Density maps were derived from SDO/AIA (1–1.3 R⊙) and SOHO/LASCO (2.5–5 R⊙). For 1.3–2.5 R⊙a combined plane-parallel and spherically-symmetric model was used (Fig. 2). An Alfvén speed map was obtained from PFSS magnetic fields within +/- 5 degrees of the POS and the 2D density map (Fig. 3). The Type II radio burst kinematics were calculated using non-radial density profiles from the 2D map. The CME kinematics were obtained from running difference height-time plots from SDO/AIA (131 Å). A comparison of the CME and Type II kinematics for 3 different propagation angles is shown in Fig. 4. INTRODUCTION Type II radio bursts are signatures of coronal shocks. They appear as slow drifting features moving towards lower frequencies in dynamic spectrum, which results from the plasma emission generated by the super-Alfvénicshocks. To date, 1D radial density models such as Newkirk (1961) and Mann et al. (1999) have been used to calculate Type II kinematics. However, due to the solar corona variability, actual density observations are crucial to obtain the correct shock kinematics. In this work, a new independent observational method to observe the mean coronal density values and the Alfvén speed in the two dimensional plane-of-sky (POS) is presented. These 2D maps are then used to calculate the kinematics and the direction of propagation of a Type II radio burst observed on 2011 September 22 (Fig.1). ABSTRACT Coronal shock waves can produce decametric radio emission known Type II bursts, which are effected by plasma density and Alfvénspeed variations in the solar corona. To date, 1D radial models of densities and Alfvénspeeds have been used, but these are not appropriate for non-radial shocks along the flanks of CMEs. Here, 2D density maps were derived using images from the Solar Dynamic Observatory/Atmospheric Imaging Assembly (SDO/AIA) and the Solar and Heliospheric Observatory/Large Angle and Spectrometric Coronagraph (SOHO/LASCO). These were then combined with potential field source surface (PFSS) extrapolations to construct 2D Alfvénspeed maps of a region of the corona where a CME and Type II radio burst was observed. We show that the a shock was formed along the leading flank of the CME at a height where the speed of the CME front becomes super-Alfvénic. RESULTS AND CONCLUSIONS A new method to derive 2D coronal density and Alfvénspeeds is presented. These were used to find evidence for a shock formed along the “upper-flank” of a CME. In addition, temporal agreement with the start of the radio emission signature and the time where the propagating feature reaches a super-Alfvénic speed was found, suggesting that the Type II emission was triggered by the erupting CME. Shock wave formation heights using 2D density and Alfvén maps of the corona Trinity College Dublin Pietro Zucca, Eoin P. Carley, D. Shaun Bloomfield, Peter T. Gallagher www.rosseobservatory.ie School of Physics, Trinity College Dublin, Dublin 2, Ireland Figure 1 Dynamic spectrum observed with e-Callsito (Benz et al. 2005) at the Rosse Solar Terrestrial Observatory (RSTO; Zucca et al. 2012) of the 2011 September 22 Type II radio burst. This burst shows fundamental (F) and harmonic (H) emission. Electron Density Magnetic Field Figure 2 Coronal density model constrained by SDO/AIA and SOHO/LASCO electron densities. The plane parallel solution (blue) models active region densities while the spherically symmetric solution (red) models the quiet Sun. The combined solution (orange) is used to model densities at 1.3-2.5 R⊙. Alfven Speed Figure 4 Height–time at different propagation angles of the EUV feature observed in SDO/AIA running difference images (red) and of Type II radio burst from different non-radial density profiles (blue). Insets show profiles separated by 10◦, with profile used marked with in red. (a) Height–time for a “low-flank” region (20◦from limb tangent). (b) An “upper-flank” region (60◦from limb tangent). (c) Radial profile (90◦from the tangent). REFERENCES AschwandenM. J., BoernerP., SchrijverC. J., MalanushenkoA., Solar Physics, Volume 283, Issue 1, pp.5-30, 2011 Benz A.O., Monstein C., Meyer H., Solar Physics, Volume 226, Issue 1, pp.143-151, 2005 Newkirk, G., Jr.,AstrophysicalJournal, Volume 133, p.983, 1961 Mann, G., Jansen, F., MacDowall, R. J., Kaiser, M. L., & Stone, R. G. , Astronomyand Astrophysics, Volume 348, p.614-620, 1999 Zucca P., CarleyE. P., McCauley J., Gallagher P. T., MonsteinC. , McAteerR. T. J., Solar Physics, Volume 280, Issue 2, pp.591-602 Figure 3 (a) 2D electron density map measured on 2011 September 22. (b) Magnetic field strength from PFSS and on (c) Alfvén speed map obtained from the electron density and magnetic field strength values.