Download
1 / 115
1.17k likes | 1.19k Vues
The spectacular migration pathways of seven migrant bird species — similar routes are followed by many others. The distribution of the world’s bird species by biogeographic realm and country. PALEARCTIC (937 species). NEARCTIC (732 species). OCEANIC (187 species). INDOMALAYAN

E N D
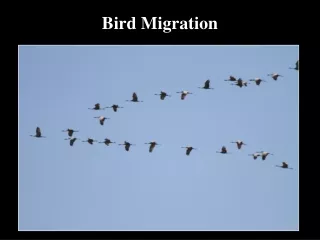
The spectacular migration pathways of seven migrant bird species — similar routes are followed by many others
The distribution of the world’s bird species by biogeographic realm and country PALEARCTIC (937 species) NEARCTIC (732 species) OCEANIC (187 species) INDOMALAYAN (c.1,700 species) OCEANIC (187 species) NEOTROPICAL (c.3,370 species) AFROTROPICAL (c.1,950 species) Number of bird species up to 200 201–400 401–600 601–800 801–1,000 1,101–1,200 1,201–1,400 1,401–1,600 1,601–1,800 AUSTRALASIAN (1,590 species) ANTARCTIC (c.85 species)
Widespread European farmland birds have declined by over a third since the 1960s 120 110 100 Population index (1966 = 100) 90 80 70 60 1965 1970 1975 1980 1985 1990 1995 2000
In the USA, Red-winged Blackbird populations are declining in 25 out of 38 states 4.0 2.0 0.0 -2.0 Population trend 1980–1999 (%/year) -4.0 -6.0 -8.0 -5.0 -4.0 -3.0 -2.0 -1.0 0.0 1.0 2.0
Species richness declined in many parts of eastern Australia between 1977–1981 and 1998–2002, particularly in those that have recently lost significant areas of native habitat % change in species richness between atlases >-25 -25– -10 -10–10 10–25 >25 insufficient data Extent of recent habitat clearance (ha) >20,000 10,000–19,999 5,000–9,999 1,000–4,999 <1,000 no data
In Botswana, the number of woodland raptors recorded during dry-season point counts (n = 984) declined markedly with increasing distance from the core of protected areas 100 90 80 70 60 50 Abundance index (% of numbers in core) 40 30 20 10 0 Core Periphery 0-15 15-30 30-50 >50 Distance from protected-area boundary (km)
More than a third of 346 populations of Anatidae (ducks, geese and swans) for which trends are known are in decline Fluctuating 2% Extinct 4% Increasing 22% Decreasing 37% Stable 35%
The number of Gyps vultures recorded along a standard set of road transects in India declined dramatically between 1991–1993 and 2000 25,000 20,000 15,000 Number of individuals 10,000 5,000 0 White-rumped Vulture Indian and Slender-billed Vultures
Albatross species breeding at Bird Island (South Georgia) have declined steadily since the 1970s (the graphs show regression lines fitted to the annual census data) Wandering Albatross 1,600 1,400 1,200 1,000 1975 1980 1985 1990 1995 2000 2005 Grey-headed Albatross 500 400 Number of breeding pairs 300 200 100 0 1975 1980 1985 1990 1995 2000 2005 Black-browed Albatross 300 200 100 0 1975 1980 1985 1990 1995 2000 2005
The rate of extinctions on islands remains high but appears to be slowing. However, the rate of extinctions on continents is still increasing [totals include bird species listed as Extinct, Extinct in the Wild and Critically Endangered (Possibly Extinct)] 18 16 14 12 10 Extinctions per 25 years 8 6 4 2 0 1700 1750 1800 1850 1900 1950 1500 1550 1600 1650
The percentage of 1,081 Australian bird taxa retrospectively assigned to each of the IUCN Red List categories, at 50-year intervals from 1750 to 2000 20 15 Extinct Critically Endangered Endangered Vulnerable NearThreatened 10 % of bird taxa 5 0 1750 1800 1850 1900 1950 2000
The proportion of bird species remaining (I) in five Kenyan forest fragments plotted against time since isolation. Half the number that are expected to disappear (I = 0.5) have gone by 23–80 years after isolation. Red lines represent exponential rates of decline for the smallest (Malava) and largest (Kakamega) fragments 1.0 0.9 0.8 Ikuywa 0.7 Yala 0.6 Kagamega 0.5 Proportion of species remaining (I) 0.4 Kisere 0.3 0.2 Malava 0.1 0.0 0 50 100 150 Years since isolation
The number of threatened birds in insular South-East Asia correlates closely with the number of bird extinctions predicted by extent of forest loss (n = 23 island archipelagos). The (red) regression line does not differ significantly from a perfect positive correlation (green line) 20 15 Number of threatened species 10 5 0 0 5 10 15 20 Number of predicted extinctions
Species density 1 21 Density of GTBs extirpated from parts of their ranges across South and Central America and the Caribbean
(a) 1,211 bird species are threatened with global extinction (b) 179 bird species are classified as Critically Endangered Critically Endangered 179 { Threatened Endangered 344 Vulnerable 688 Extinct in the Wild 4 (<1%) Threatened 1,211 (12%) Near Threatened 774 (8%) Least Concern 7,721 (79%) Data Deficient 78 (<1%)
Population sizes of GTBs 500 400 300 Number of species 200 100 0 Tiny (<50) Extremely small (50–249) Very small (250–2,499) Small (2,500– 9,999) Medium–large (³10,000) Unknown Population size (number of individuals)
Population trends of GTBs 600 500 400 300 Number of species 200 100 0 ³80 50–79 30–49 1–29 Stable Fluctuating Increasing Unknown % decline per 10 years or three generations
Range sizes of GTBs 350 300 250 200 Number of species 150 100 50 0 1–10 11–100 101–1,000 1,001– 10,000 10,001– 100,000 100,001– 1 million >1 million Range size (km2)
The Red List Index for birds The Red List Index for Critically Endangered birds 1988 1992 1996 2000 2004 1988 1992 1996 2000 2004 0 0.00 Better Better -0.01 -0.01 -0.02 -0.02 Red List Index Red List Index -0.03 -0.03 -0.04 -0.04 -0.05 Worse Worse -0.06 -0.05
Species experts judge that almost half of GTBs have declined in status during 2000–2004, and only 11% have improved Improved 11% Deteriorated 45% No significant change 44%
Red List Indices for birds in different regions 1988 1992 1996 2000 2004 Europe Africa Pacific Americas Middle East Asia 0.02 0.00 Better -0.02 Red List Index -0.04 -0.06 Worse -0.08 -0.10
Savanna/shrubland/grassland Forest Wetlands Marine Red List Indices for birds in different habitats 1988 1992 1996 2000 2004 0.00 -0.02 Better -0.04 Red List Index -0.06 -0.08 Worse -0.10
Red List Indices for selected species-groups 1988 1992 1996 2000 2004 Pigeons Waterbirds Parrots Raptors Gamebirds Seabirds 0.00 -0.02 Better -0.04 -0.06 Red List Index -0.08 -0.10 Worse -0.12 -0.14 -0.16
Density map of GTBs across the world Species density 1 9 16-24
Number of GTBs on continents and islands GTBs shared with at least one other continent/island class GTBs restricted 700 600 500 400 Number of Species 300 200 100 0 Continents Continental-shelf islands Oceanic islands
Density map of threatened seabirds in the southern oceans Species density 1 10 22
The countries with the highest numbers of GTBs Endemic to country Shared 140 120 100 80 Number of species 60 40 20 0 Indonesia Brazil Peru Colombia China Ecuador India New Zealand USA Philippines
The countries with the most threatened avifaunas (marked in red on a regression of number of GTBs against total number of bird species for each country) Indonesia 6 Philippines China Brazil New Zealand 5 USA Peru French Polynesia Norfolk Island 4 Number of species Cook Islands 3 2 1 0 1 2 3 4 5 6 7 8
The importance of each major habitat type for all bird species and for GTBs Non-threatened Globally Threatened 7,000 6,000 5,000 Number of species 4,000 3,000 2,000 1,000 0 Forest Artificial Shrubland Grassland Savana Wetlands Coastal Marine Desert
The relative importance of each major habitat type for GTBs Importance Unknown Minor Critical/major 900 800 700 600 Number of species 500 400 300 200 100 0 Forest Shrubland Grassland Wetlands Coastal Marine Savanna Desert Artificial
The importance of each major forest type for all bird species and for GTBs Non-threatened Globally Threatened 4,000 3,500 3,000 2,500 Number of species 2,000 1,500 1,000 500 0 Subtropical/tropical lowland moist forest Subtropical/tropical montane moist forest Subtropical/tropical dry forest Temperate forest Subtropical/tropical mangrove Boreal forest
Tolerance of GTBs to forest degradation High 3% Unknown 11% Low 45% Medium 41%
The terrestrial biomes of western Eurasia, the Middle East, Africa and Madagascar Biome (number of bird species confined to biome) Eurasian Arctic tundra (60) Eurasian boreal forests/taiga (62) European temperate forests (13) Eurasian high montane (58) Eurasian steppe (18) Mediterranean (24) Irano-Turanian mountains (22) Eurasian deserts and semi-deserts (17) Sahara-Sindian (38) Sahel (16) Sudan-Guinea savanna (54) Guinea-Congo forests (278) Lake Victoria basin (12) Afrotropical highlands (240) Somali-Masai (129) East African coast (36) Zambezian (67) Kalahari-Highveld (13) Namib-Karoo (23) Fynbos (9) West Malagasy (24) East Malagasy (45)
The relationship between restricted-range bird species and GTBs Restricted-range species Widespread species 100 80 % of species 60 40 20 0 All species (n = 9,917) GTBs (n = 1,211)
The location of the world’s 218 EBAs Extent and boundary of EBA Central point within EBA
The historical and current relationship between numbers of restricted-range species and the area that they occupy Current relationship Historical relationship Today, 20% of the world’s birds are found in natural habitats in just 1% of the land surface 3,000 2,000 In 1800, 20% of the world’s birds were confined to natural habitats in 2% of the land surface Number of restricted-range species 1,000 0 0 5 10 15 Area (million km2)
The IBAs of global significance that have already been identified Areas of the world where the process of IBA identification is still in progress
Percentages of sites in Europe, the Middle East and Africa that meet the different IBA criteria IBA criteria Globally threatened Restricted range Biome-restricted Congregatory Europe Middle East Africa 19% 32% 38% 29% 47% 15% 30% 2% 54% 19% 6% 9%
The 34 IBAs identified for Blue Swallow cover 8.4% of its estimated total range Important Bird Areas Non-breeding Breeding Non-breeding Breeding Range
Eighteen IBAs in Ecuador and Peru capture all 17 restricted-range species of the Ecuador–Peru East Andes Endemic Bird Area. Sites are indicated for three of these species COLOMBIA Ecuador–Peru East Andes EBA Number of restricted-range species Bicoloured Antvireo 11–14 6–10 3–5 1–2 ECUADOR Coppery-chested Jacamar White-necked Parakeet PERU
In all, 105 IBAs have been identified across 22 countries in Africa to conserve the 54 bird species that are wholly confined to the Sudan–Guinea savanna biome, and many other species besides Important Bird Area Biome Sudan–Guinea savanna Transition zone with Guinea-Congo forests
The network of wetland IBAs identified for the migratory Eurasian Spoonbill in Europe, the Middle East and Africa covers sites that are important for the species at different times of the year Important Bird Areas Breeding Non-breeding Passage Resident
In the Taita Hills of south-east Kenya, forest-dependent birds will fly distances of more than 35 km between forest fragments, across intervening degraded habitat Mbololo (220 ha) Ngangao (92 ha) 0 5km Ronge (4 ha) 1 dispersal event 2–4 dispersal events ³5 dispersal events Yale (2 ha) Vuria (1 ha) Macha (3 ha) Mwachora (4 ha) Fururu (12 ha) Kichuchenyi (2 ha) Ndiwenyi (4 ha) Sagala (3 ha) Chawia (50 ha)
The percentage of Ugandan butterfly species represented in Ugandan IBAs in each of six conservation priority categories 100 90 16 80 All species 67 2 70 60 73 20 16 % of Ugandan species 50 40 30 20 10 0 1 2 3 4 5 6 Conservation priority score
Number of taxon groups in addition to birds for which Turkey’s 156 IBAs hold internationally significant populations Birds + 5 other groups 4% Birds + 4 other groups 14% Birds only 28% Birds + 3 other groups 14% Birds + 1 other group 18% Birds + 2 other groups 22%
The main threats to GTBs world-wide Unknown impact Low impact High/medium impact 1,000 800 600 Number of GTBs 400 200 0 Habitat destruction/ degradation Exploitation Invasive species Human disturbance Natural disasters Pollution Changes in native species Incidental mortality Persecution Intrinsic factors
Agricultural expansion and intensification threaten 50% and 35% of African and European IBAs respectively Africa (853 IBAs for which appropriate threat data are available, out of a total of 1,230) Europe (1,147 IBAs affected by high-impact threats only, out of a total of 3,619) 50 40 30 % of IBAs impacted 20 10 0 Agricultural expansion & intensification Shifting agriculture Aquaculture & fisheries Timber extraction Firewood collection & forest grazing Afforestation, timber plantations & intensified forest management Urbanisation & industrialisation Mining Commercial deforestation
1750 1850 1950 1990 The timing and expansion of agricultural land from 1700 to 1990 Colours indicate the period in which relatively intact habitats were converted to agricultural land
Over 300 years substantially more land in EBAs has been converted to cropland and pasture than in the rest of the world EBAs Rest of the world 50 40 30 % cropland and pasture 20 10 0 1700 1800 1900 2000