Download

1 / 29
290 likes | 407 Vues
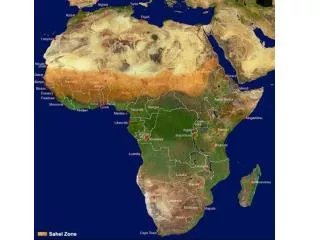
Solution for Africa’s Global Communications. Professor Victor Lawrence Chairman Baharicom Development Company . Global Telecom Infrastructure 2009 . Africa: Missing from the Global Telecom Infrastructure. 0.12 Tbps. 0.13 Tbps.

E N D
NGAC is NCEP’s global aerosol system that couples NCEP’s GFS with GSFC’s GOCART. It is an in-line atmospheric-aerosol system • Phased Implementation: • Dust-only guidance to be established in Q4FY12 (10 Sept 2012) • Full-package aerosol forecast after real-time global smoke emissions are available and tested (NCEP-NESDIS-GSFC collaborative activities funded by NOAA-NASA-DOD Joint Center for Satellite Data Assimilation) • For Q4FY12 implementation: 5-day dust forecast once per day (at 00 UTC), output every 3 hour at T126 (~ 1 deg) resolution and 64-vertical layers • A quick study was conducted to compare NGAC results with TAQM, GSFC’s GEOS-5, NRL’s NAAPS, ECMWF’s MACC, and JMA’s MASINGAR for the 2012-04-26 Asia dust event • This ppt shows mass concentration comparison (NGAC, GEOS-5, TAQM) and then AOD comparison (NGAC versus ICAP models). TAQM and ICAP results are taken from their web sites, respectively (THANKS), and NGAC results are displayed using the same color scheme. • In the nut shells, this study provides confidence that the quality of NGAC dust products is comparable to that produced by other centers. However, in-depth study is needed to examine and understand how well dust emissions (sub-grid process, displacement of dust plumes) and removal processes (in particular, wet removal) are represented in NGAC.
Compare NCEP’s NGAC (1.0 deg) vs GSFC’s GEOS-5 (0.25 deg) 120-hr forecast, initialized on 26 Apr 2012, 00Z. NGAC and GEOS-5 have the same GOCART module. GEOS is ran at higher resolution with MODIS AOD assimilation. FH 12 TAQM simulation is initialized on 12Z, so we are compare hr12 from NGAC/GEOS -5 versus hr01 from TAMQ TAQM
FH 24 TAQM (26 Apr, 23Z) Off by one hour
FH 48 TAQM (27 Apr, 23Z)
FH 72 TAQM (28 Apr, 23Z)
FH 96 TAQM (29 Apr, 23Z)
FH 120 TAQM (30 Apr, 23Z)
NGAC Z=8 HGT: 0.5 – 5.5 km ~ 0.5 km above sfc NGAC Z=12 HGT: 1.0-6.0 km ~ 1 km above sfc NGAC Z=15 HGT: 2.0 – 6.5 km ~ 2 km above sfc NGAC has lower dust loading aloft than TAQM
(42N, 105E) (42N, 95E) (42N, 115E) Y-axis is NGAC vertical levels, labeled with approximate height above sfc 1 km 600m 300m 100m NGAC has zero displacement velocity of dust plumes (i.e., all dust emissions are released to the lowest model layer). Need to revisit this and profiled observations / simulation results are needed.
NRL NGAC vs ICAP models for FH 012 Extensive areal coverage seen in NGAC is also found in dust forecasts from other models. NCEP ECMWF JMA GSFC
NRL FH24 NCEP ECMWF JMA GSFC
NRL FH48 NCEP ECMWF JMA GSFC
NRL FH72 NCEP ECMWF JMA GSFC
NRL FH96 NCEP ECMWF JMA GSFC
NRL FH120 NGAC results are consistent with other models in the bulk part, but NGAC seems have weaker dust removal than other models. NCEP ECMWF JMA GSFC