Download
1 / 57
570 likes | 663 Vues
Brain and Behavior: Obesity and Weight Control. Rena R. Wing, Ph.D. Professor of Psychiatry and Human Behavior Brown Medical School Director, Weight Control & Diabetes Research Center The Miriam Hospital. Brain & Behavior April 2005. Weight = Energy In – Energy Out. Accuracy:

E N D
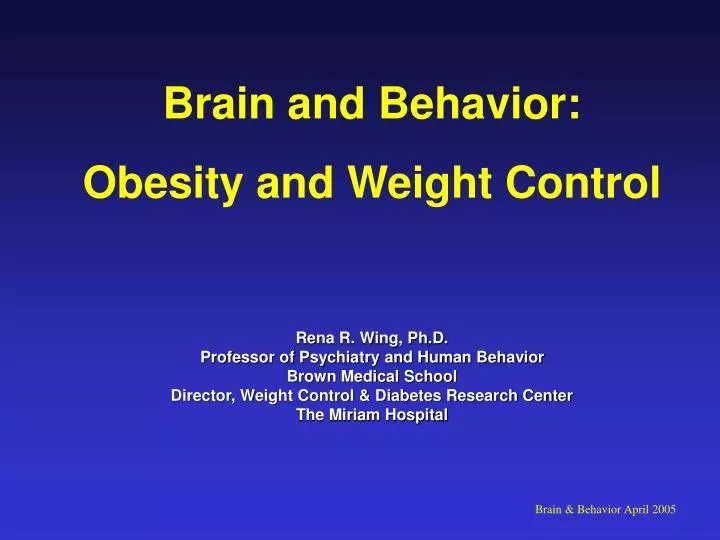
Brain and Behavior: Obesity and Weight Control Rena R. Wing, Ph.D. Professor of Psychiatry and Human Behavior Brown Medical School Director, Weight Control & Diabetes Research Center The Miriam Hospital Brain & Behavior April 2005
Accuracy: • Energy intake in one year = 955,000 calories • Gaining one pound in one year = 3,500 • calories • Error of 0.4% or 11 calories per day will • produce a weight gain of one pound
Am J Physiol Gastrointest Liver Physiol 286: G7-G13, 2004; 10,1152/ajpgi. 00448.2003.
Obesity Trends Among U.S. Adults between 1985 and 2002 • Body Mass Index (BMI):kg / m2 • weight in kilograms divided by height in meters squared • Obese: BMI > 30
No Data <10% 10%–14% Obesity Trends* Among U.S. AdultsBRFSS, 1985 (*BMI ≥30, or ~ 30 lbs overweight for 5’ 4” woman)
No Data <10% 10%–14% Obesity Trends* Among U.S. AdultsBRFSS, 1986 (*BMI ≥30, or ~ 30 lbs overweight for 5’ 4” woman)
No Data <10% 10%–14% Obesity Trends* Among U.S. AdultsBRFSS, 1987 (*BMI ≥30, or ~ 30 lbs overweight for 5’ 4” woman)
No Data <10% 10%–14% Obesity Trends* Among U.S. AdultsBRFSS, 1988 (*BMI ≥30, or ~ 30 lbs overweight for 5’ 4” woman)
No Data <10% 10%–14% Obesity Trends* Among U.S. AdultsBRFSS, 1989 (*BMI ≥30, or ~ 30 lbs overweight for 5’ 4” woman)
No Data <10% 10%–14% Obesity Trends* Among U.S. AdultsBRFSS, 1990 (*BMI ≥30, or ~ 30 lbs overweight for 5’ 4” woman)
No Data <10% 10%–14% 15%–19% Obesity Trends* Among U.S. AdultsBRFSS, 1991 (*BMI ≥30, or ~ 30 lbs overweight for 5’ 4” woman)
No Data <10% 10%–14% 15%–19% Obesity Trends* Among U.S. AdultsBRFSS, 1992 (*BMI ≥30, or ~ 30 lbs overweight for 5’ 4” woman)
No Data <10% 10%–14% 15%–19% Obesity Trends* Among U.S. AdultsBRFSS, 1993 (*BMI ≥30, or ~ 30 lbs overweight for 5’ 4” woman)
No Data <10% 10%–14% 15%–19% Obesity Trends* Among U.S. AdultsBRFSS, 1994 (*BMI ≥30, or ~ 30 lbs overweight for 5’ 4” woman)
No Data <10% 10%–14% 15%–19% Obesity Trends* Among U.S. AdultsBRFSS, 1995 (*BMI ≥30, or ~ 30 lbs overweight for 5’ 4” woman)
No Data <10% 10%–14% 15%–19% Obesity Trends* Among U.S. AdultsBRFSS, 1996 (*BMI ≥30, or ~ 30 lbs overweight for 5’ 4” woman)
No Data <10% 10%–14% 15%–19% ≥20 Obesity Trends* Among U.S. AdultsBRFSS, 1997 (*BMI ≥30, or ~ 30 lbs overweight for 5’ 4” woman)
No Data <10% 10%–14% 15%–19% ≥20 Obesity Trends* Among U.S. AdultsBRFSS, 1998 (*BMI ≥30, or ~ 30 lbs overweight for 5’ 4” woman)
No Data <10% 10%–14% 15%–19% ≥20 Obesity Trends* Among U.S. AdultsBRFSS, 1999 (*BMI ≥30, or ~ 30 lbs overweight for 5’ 4” woman)
No Data <10% 10%–14% 15%–19% ≥20 Obesity Trends* Among U.S. AdultsBRFSS, 2000 (*BMI ≥30, or ~ 30 lbs overweight for 5’ 4” woman)
Obesity Trends* Among U.S. AdultsBRFSS, 2001 (*BMI ≥30, or ~ 30 lbs overweight for 5’ 4” woman) No Data <10% 10%–14% 15%–19% 20%–24% ≥25%
Obesity Trends* Among U.S. AdultsBRFSS, 2002 (*BMI ≥30, or ~ 30 lbs overweight for 5’ 4” woman) No Data <10% 10%–14% 15%–19% 20%–24% ≥25% Source: Behavioral Risk Factor Surveillance System, CDC
Overweight & Obesity in Rhode Island (2003) Overweight 38.5% Obese 18.4% TOTAL 56.9%
Toxic Environment: Sedentary lifestyles • Television • Computers • Cell phones • Remote controls
Physiological Individual/ Behavioral Sociocultural
B A C Antecedents Consequences Behaviors
B A C Antecedents Consequences Behaviors Low fat, Low Calorie Diet, Physical Activity
B A C Antecedents Behaviors Consequences Low fat, Low Calorie Diet, Physical Activity Stimulus Control Changing Thoughts and Feelings Positive Reinforcers Contingency Contracts Self-Monitoring, Goal-setting
Source of Calories • Fat ……………… 9 calories/gram • Carbohydrates …. 4 calories/gram • Protein …………. 4 calories/gram • Alcohol ………… 7 calories/gram
Weight < 200 lbs 1000 - 1200 20 - 30% 22 - 40 Weight > 200 lbs 1500 - 1800 20 - 30% 33 - 60 Low Calorie - Low Fat Diet Recommendations Calories Fat % Fat (g)
Mean Percent Change in Weight among Subjects on the Low Carbohydrate Diet and Those on the Conventional Diet Baseline Carried Forward Analysis * * Conventional diet Low-carbohydrate diet 0 3 6 912 Month NEJM 348;21 2003
Weight Loss Maintenance Using Meal Replacements Standard then Meal Replacement Meal Replacement 0 2 4 6 8 10 12 14 16 18 20 22 24 26 28 Time (months) Ditschuneit et al., AJCN; 1999; 69: 198-204
Law of Thermodynamics Energy In Energy Out Food and liquid intake (100%) Resting Metabolic Rate (65%) Thermic Effect of Food (10%) Exercise (25%)
Does exercise alone produce weight loss?Yes – but modest (2-4 kg) • Does diet and exercise produce greater initial weight loss than diet only?Yes – but modest (2 kg) • Does diet and exercise produce better long-term weight loss than diet only?Yes
Long Term Weight Loss Study Diet Only Diet + Exercise Pavlou 18 mo -3 -11 Sikand 2 yr -0.8 -9.2 Skendner 1 yr -6.8 -8.9 2 yr +0.9 -2.2 Wadden 1 yr -15.3 -13.5 2 yr -6.9 -8.5 Wing 1 yr -3.8 -7.9 Wing 1 yr -5.5 -7.4 2 yr -2.1 -2.5
Physical Activity Strategies • Short bouts • Home exercise • Aerobic vs resistance
Dose Response of Exercise on Weight Loss 0 -2 -4 -6 -8 -10 -12 -14 -16 <150 min/wk >150 min/wk Change in Body Weight, kg >200 min/wk 6 12 18 Time, mo
B A C Antecedents Behaviors Consequences Low fat, Low Calorie Diet, Physical Activity Stimulus Control Changing Thoughts and Feelings Positive Reinforcers Contingency Contracts Self-Monitoring, Goal-setting
Modest Weight Loss Improves Health • Improves glycemic control • Improves cardiovascular risk factors • Improves psychological well-being • Prevents or delays onset of type 2 diabetes
Diabetes Prevention Program • Over 3000 overweight adults with impaired glucose tolerance • Randomly assigned to: • Intensive lifestyle intervention • Metformin • Placebo • Followed annually for over 3 years
Goal-based Behavioral Intervention • An intensive program with the following specific goals: > 7% loss of body weight and maintenance of weight loss > 150 minutes/week of physical activity
Lifestyle Intervention Results • Average activity = 225 minutes/week • 74 % met goal at week 24 • 58% met goal at end of study • Average weight loss = 7% (7 kg or 14 lb) at week 24 and 4% (4 kg or 8.8 lb) at end of study • 50% met 7% weight goal at week 24 • 38% met 7% weight goal at end of study
Mean Weight Change Placebo Metformin Lifestyle The DPP Research Group, NEJM 346:393-403, 2002
Incidence of Diabetes Risk reduction 31% by metformin 58% by lifestyle