Download

1 / 77
820 likes | 1.19k Vues
Chapter 7 Normal Distribution & Brownian motion. 7.1 Normal distribution. Lecture 12 Apr. 17, 2013. Prof. Bob Li. Normal distribution (Gaussian distribution). Theorem. The function is a probability density function. // of the standard normal distribution.

E N D
Chapter 7Normal Distribution & Brownian motion Prof. Bob Li
7.1Normal distribution Prof. Bob Li
Lecture 12 Apr. 17, 2013 Prof. Bob Li
Normal distribution (Gaussian distribution) • Theorem. The function • is a probability density function. • // of the standard normal distribution. • // About 68.26% of the area under the curve is within 1 from the middle value 0. • // 95.44% 2 • // 99.74% 3 f(x) 0.6826 Prof. Bob Li
Tabulation of values for the standard normal distribution function F(x) from the Rossbook f(x) .6826 (.8413 .5)2 = .6826 (.9772 .5)2 = .9544
Proof of total probability 1 • Proof. To show that , consider the square of this integral. • 2 • = 2 2 ¥ p 2 [ ] r / 2 = - q ò ò e d r d r // Convert into polar coordinates 0 0 2 ¥ = ò r / 2 - e r d r 0 Prof. Bob Li
Mean & variance of standard normal distribution • The mean of the standard normal distribution is 0 because the density function is an "even" function, i.e., f (x) = f (x). • To calculate the variance , substitute x with in • , where w and x are independent variables. • Differentiate with respect to w, • Let w = 1. We find the variance of the standard normal distribution to be 1. • // Alternatively, this variance can be calculated through Laplace transform.
Rescaling a continuous distribution Note. The density function of bXis Prof. Bob Li
Rescaling the normal distribution Prof. Bob Li
Rescaling the normal distribution Corollary. For any m and any >0, the function is the density function for a distribution with mean m and variance 2, which is called the Normal(m, 2) distribution. • // About 68.26% of the area is within • 95.44% 2 • 99.74% 3 • // from the middle value m.
7.2Central limit theorem Prof. Bob Li
A great discovery in mathematics • There is a particular distribution specifiable by the mean and variance such that • every other distribution, when repeated many times, just approximates it. Prof. Bob Li
Standardizedsum of i.i.d. • For i.i.d. X1 = X, X2, ..., Xn with EX= m and Var(X) = 2, Var(nX) = n22 Var(X1+X2+ ... +Xn) = n2// Variance of indep. sum is sum of variances. • Var() = 1 • Var() = 1// The “standardized ” sum of i.i.d. • // A standardized r.v. has mean 0 and variance 1. Prof. Bob Li
Central Limit Theorem • Every distribution, when repeated many times, becomes approximately normal. In other words, the sum of any i.i.d. is asymptotically normal. • Central Limit Theorem (CLT). Thestandardized sum of i.i.d. X1 = X, X2, ... , Xnis asymptotically of the standard normal distribution. Write EX = m and Var(X) = 2. Then, • for all b. Prof. Bob Li
Proof of CLT by Fourier transform • Consider the Fourier transform of an r.v. X with EX = m and Var(X) = 2. • // In order for convergence, we have chosen Fourier transform over other transforms. • Take the Taylor expansion, • When m = 0, • Applying to the r.v. (Xm)/, which has variance 1/n. Prof. Bob Li
Proof of CLT by Fourier transform • Let X1 = X, X2, ... , Xn be i.i.d. Write • Y = the standardized sum • // From computation in the above • = Fourier transform of the standard normal distribution // Well known as n // By L'Hospital rule Prof. Bob Li
Symmetric Random Walk • Let X1 = X, X2, ... , Xn be i.i.d. with P(X = 1) = 0.5 = P(X = 1). • // Think of each Xjas one step in symmetric random walk. • Clearly, m = EX = 0 and 2 = Var(X) = 1. • The position after n steps is X1 + X2 +... + Xn, which has the mean nm = 0 and variance n2 = n. CLT asserts that, as n , Prof. Bob Li
Pin ball at Museum of Science • In the museum, let Xj represent the jth bounce of a ball with P(X = 1) = m. • // Xj = 1 for right • = 0 for left Through n bounces, a ball reaches the final position X1+X2+...+Xn. (X1+X2+...+Xn nm)/ The standard normal r.v. Since m = ½, the standardized sum is: • 2(X1+X2+...+Xn) n)/ • Normal(0, 1) r.v. Prof. Bob Li
CLT for zero-one i.i.d. • Assumption: X1 = X, X2, ... , Xn are zero-one i.i.d. with P(X = 1) = m • // and P(X = 0) = 1m • Thus, EX = m and Var(X) =E[X2] m2 = mm2. • X1+X2+...+Xn is Binomial(n, m) distributed. Clearly, • E[X1+X2+...+Xn] = nmand Var(X1+X2+...+Xn) = n(mm2). From CLT, as n , (X1+X2+...+Xn nm)/ The standard normal r.v. Thus, Binomial(n, m)after standardization bell shape ofstandardnormal. • // Not to be confused with: Binomial(n, /n) Poisson() Prof. Bob Li
Statistical prediction • Before an experiment, we know the distribution of the outcome X and want to predictthe outcomewhile minimizing the error. • Problem. Find a predicted value c that minimizes themean of the square of the error E[(Xc)2]. • Solution. E[(Xc)2] = c2 2cEX + E[X2], where EX and E[X2] are known. Differentiating w.r.t. c, we find the amountE[(Xc)2] achieve its minimum value Var(X) at c = EX. Thus, the best predictor, in the sense of minimizing the mean square error, is simply c = EX. • // This solution requires knowing EX. • Natural generalization. Assume the knowledge of a certain prior event related to X. We can subject the above formulation to the àpriori of this event. The best predictor of the conditional r.v. (X | event), in the sense of minimizing E[(Xc)2 | event], is E[X | event]. Prof. Bob Li
Statistical estimation • Knowing EX, the best predicted value of the outcome is c = EX. Conversely, when the value of EX is unknown, it can be estimated by averaging the observed values in repeated experiments. • // If there is only one observed value, then just use that value as the estimate. • Question. How close is EX to the observed average in n repeated experiments? • First, how to formulate closeness in this stochastic setting? Prof. Bob Li
The concept of estimation error • Formulation. Let Y = X1+X2+...+Xn, where X1 = X, X2, ... , Xnare i.i.d. withEX= m and Var(X) = 2. How small is the estimationerrorY/nm? • When n is large, CLT gives • for all b. Or equivalently, • Here three parameters are involved: // Any two among them determine the third. • The sampling size n. • The error tolerance of Y/nm // Or of Y nm. • The confidence level, which is the approximate probability when nis reasonably large. Prof. Bob Li
Sampling size & error tolerance confidence level • Example.Given that Var(X) = 2 = 1, we are to estimate EX = m via n = 400 repeated experiments. Represent the experimental outcomes by the i.i.d. sequence X1, X2, ... , Xn. Write Y = X1+X2+...+Xn. The estimate of m is the observed average value Y/n. Allowing an error margin of 0.15, what is the confidence level? • Solution. From CLT, • As n = 400 and = 1, we choose b = 3 so that = 0.15. • Confidence level • = 0.9974 // By table look-up • Note. This confidence level is true for any m because it is unchanged when X is shifted to an r.v. with zero mean. However, there is a subtlety in the accuracy of in CLT. If the higher moments of Xm is large, then the confidence level may be somewhat lower.
Confidence level & error tolerance sampling size • Example.Assume that voters are i.i.d. How many voters have to be polled in order to ensure 95% confidence level for a prediction allowing only 4% error? • Solution. A zero-one r.v. X represents a voter in an election poll. // Yes-No r.v. • We are to estimate P(X = 1) = m. This time, Var(X) = 2 is unknown. • Let Y = X1 + X2 + ... + Xn. From CLT, • Through table look-up, choose b = 1.96 so that • We allow an error tolerance of 0.04 in predicting the value m by the observed Y/n. Thus, we want n to be large enough to ensure 0.04. • Since 2 = mm2= 0.25 (m0.5)2 0.25, a sampling size of n = 601 suffices. Prof. Bob Li
Confidence level & error tolerance sampling size • A sampling size n = 601 24010.25 24012 suffices to achieve 95% confidence level for a prediction allowing only 4% error. • If the resulting estimate of m is approximately 0.5, then 2= mm2 0.25 and hence the sampling size indeed needs to be close to 601. • On the other hand, if the estimate deviates substantially from 0.5, then 2 is substantially lower than the upper bound 0.25 used in the calculation and hence we could have • raised the confidence level over 95%, • tightened the error tolerance below 4%, or • poll fewer than 601 voters. Prof. Bob Li
SkipConfidence level & error tolerance sampling size • (Tightened the error tolerance below 4%.) It is convenient to tighten the error tolerance after polling 601 voters. For instance, let the poll result gives 2/3 of YES votes. This is interpreted as P(X = 1) = m 2/3 and hence 2 = m(1m) = 2/3 4/9 or = 0.471. Thus, at the same 95% confidence level, the error is actually within only = 0.4711.96/24 = 3.85% instead of 4%. • (Poll fewer than 601 voters.) On the other hand, if the confidence level and error tolerance are fixed, we can reduce the sample size. Without any way to estimate the value of 2 = m(1m) before polling, what we can do is to sample, say, 200 voters first to establish a pre-estimate of m and hence also of 2. Then, use the pre-estimate of 2 to calculate n. If, for instance, the pre-estimate gives m = 2/3 and hence 2 = 0.222, a sampling size of n = 533 sufficesfor 0.04. Prof. Bob Li
7.3Brownian motion Prof. Bob Li
Sum of independent normal r.v. • From CLT, sum of any i.i.d. is asymptoticallynormal. The following theorems asserts that sum of normal i.i.d. is normal. • Theorem. The sum of two independent normal r.v.is normal. • Intuitive proof. With a simple shift, we may assume that the two normal r.v. are Normal(0, 12) and Normal(0, 22), respectively. We are to show that their sum is Normal(0, 12+22). • Consider an r.v. X = with equal probabilities. Thus, EX = 0 and Var(X) = The sum of 1,000,00012independent copies of X is approximately Normal(0, 12). The sum of 1,000,00022independent copies is approximately Normal(0, 22) r.v. // Variance of indep sum = sum of variances • The sum all the 1,000,000(12+22) independent copies of X approximates the sum of these two independent normal r.v. and, at the same time, also approximates a Normal(0, 12+22) r.v.
skipAlternative proof by Fourier transform • Proof by Fourier transform. Recall that the Fourier transform of the standard • normal r.v. X is . • The r.v. X+m is Normal(m, 2) distributed. Therefore the Fourier transform of the Normal(m, 2) distribution is • The Fourier transform of the Normal(m+q, 2+2) distribution is • = Product of the Fourier transforms of Normal(m,2) and Normal(q, 2) r.v. • = Transform of the sum of two independent normal r.v. Prof. Bob Li
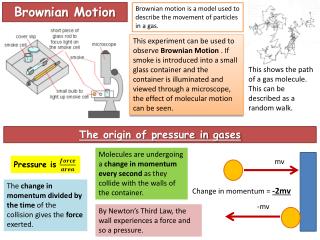
Particle movement In physics, Brownian motion is the presumably random moving of particles suspended in a fluid (a liquid or a gas) resulting from their bombardment by the fast-moving atoms or molecules in the fluid. Observed properties of movement: • There is a definite probability distribution of the horizontal-dim displacement at any time t. // And similarly of the vertical-dim displacement • The motion is isotopic (i.e., stationary increment): no matter when you start the clock, you get the same distribution of the displacement at time t. Prof. Bob Li
History of Brownian motion (BM) In 1785, a Dutch scientist Jan Ingenhousz reported that under a microscope he had observed irregular movement of coal dust on the surface of alcohol. In 1827,abiologistRobert Brown looking through a microscope at pollen grains in water, noted that the grains moved through the water but was not able to determine the mechanisms that caused this motion. The direction of the force of atomic bombardment is constantly changing, and at different times the pollen grain is hit more on one side than another, leading to the seemingly random nature of the motion. Prof. Bob Li
History of Brownian motion (cont’d) The first person to describe the mathematics behind Brownian motion was Thorvald N. Thiele in a paper on the method of least squares published in 1880. Thiele This was followed independently by Louis Bachelier in 1900 in his PhD thesis “The theory of speculation”, in which he presented a stochastic analysis of the stock and option markets. Bachelier Albert Einstein (in one of his 1905 papers) et al. presented it as a way to indirectly confirm the existence of atoms and molecules, and called this movement as Brown motion.In fact, the BM model given by Einstein is a Markovian one. Einstein Prof. Bob Li
Definition of BM In 1923, Norbert Wiener gave the following definition. Definition. A continuous-time stochastic process {X(t), t≥0} is called a Brownian motion (BM), or sometimes a Wiener process, if : Wiener (i) Continuity: (ii) {X(t), t≥0} has stationary independent increments: (a) Independence: is independent of for all (b) Stationarity: The distribution of does not depend on t ; (iii) Normally distributed increments: For where are constant real numbers. Prof. Bob Li
Convolution of normal distributions • The Normal(0, t) distribution function is • Corollary. The family {Ft}t0of zero-mean distribution functions satisfies • Fs+t = Fs Ft • // Distribution function of indep sum = convolution of distribution functions. This theorem governs the natural phenomenon of Brownian motion (BM), which is a physical justification of the term "normal" distribution. Prof. Bob Li
Multi-dimensional BM Definition. When {X1(t)}t≥0, …, {Xd(t)}t≥0are independentBM, the stochastic process // 2-dim BM is also called planar BM. is called a d-dim BM. Prof. Bob Li
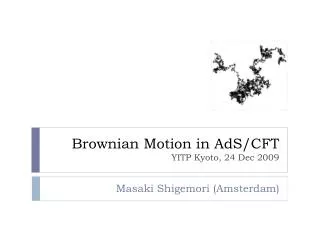
Instant snapshot of 2-dim BM Prof. Bob Li
skipSimulation of planar BM function traBM X=[]; y=[]; sx=0; sy=0; For n=1:2000 sig=10*rand; sxr=normrnd(0,sig,1,1); sx=sx+sxr; syr=normrnd(0,sig,1,1); sy=sy+syr; x=[x,sx]; y=[y,sy]; end h=plot(x,y,’:’) grid on; The following is a MATLAB program to simulate the trajectories of planar BM based on normal distributions.
Drift-free BM and standard BM Definition.A Brownian motion is drift-free if = 0. • Definition.A Brownian motion {X(t)}t0 is standardif • X(0) = 0 // Initialization • = 0 and = 1 • The density function of X(t) in the standard BM is • We now verify the standard BM against requirements in Wiener’s definition: • Property 1: Continuity • Property 2: Stationary increments • Property 3: Independent increments • Property : Normally distributed increments Prof. Bob Li
Properties of standard BM in Wiener’s definition Property 2. Stationary increment: Property 2’ (Isotopy or stationary increment). For t1 > 0, is a BM. Property 3. Independent increment: Since X(t) is independent of for all , there is the joint density function: Prof. Bob Li
Properties of standard BM in Wiener’s definition Property 1. Continuity (of continuous-parametered r.v.): For any >0, Proof. First, we may replace by X(t). has a distribution with zero mean and zero variance and is hence reduced to a point mass at position 0. Thus, // However, the sample paths are notdifferentiable (See Property 8 in the sequel.) Prof. Bob Li
Covariance of BM Property 4. Covariance: // Intuition: Movements in the overlap between intervals (0, s) and (0, t). Proof. Assume s ≤ t by symmetry. W.l.o.g. we shall prove for a standard BM. Prof. Bob Li
7.4Brownian scaling and fractals Prof. Bob Li
Scaling drift-free random walk into drift-free BM • A drift-free random walk is represented by i.i.d. X1 = X, X2, X3, ... with EX = 0 and Var(X) = 2. Thus, • and hence • Rescale this drift-free random walk in time and space: • The new stride of a step is only 1/n. • But, make n2steps in a unit time. • // Equivalently, a new unit times = (An old unit time)/n2. • The rescaling preserves the variance of the position at any time. • // And remain drift-free • Example. A drift-free random walk takes a unit step per s. After rescaling with n = 2, the new random walk takes a half-unit step in every ¼s. Prof. Bob Li
Scaling drift-free random walk into drift-free BM • Example with n = 2. A drift-free random walk takes a unit step per s. There are 100 steps in each of the ten sample paths. Space Time = 100 s
Scaling drift-free random walk into drift-free BM • Example with n = 2. A drift-free random walk takes a unit step per s. After rescaling, the new random walk takes a half-unit step in every ¼s. Space Time = 25 s Prof. Bob Li
Scaling drift-free random walk into drift-free BM • Rescale time and space of a drift-free random walk: • The new stride is only 1/n, where n is a real number. • But, the new unit times is only 1/n2 of an old unit time. • The variance of the position at any time is unchanged. • Repeat this rescaling times, the drift-free random walk becomes a drift-free BM. Same for repeating this rescaling +1 times. • Thus rescaling a drift-free BM results in the same BM. This is called the scaling invariance property of BM. • // Analogy: Start with any state of an ergodicmarkov chain. • // After or +1 transitions, the chain is in the stationary state. • The phrase Brownian scaling has been widely adopted for applications base on the scaling invariance property of BM.
Scaling invariance property of BM Property 5 (Scaling invariance). Suppose {X(t)}t ≥ 0is a drift-free BM and a > 0. Then, the process{X *(t)}t ≥ 0defined by is the same drift-free BM. Proof. For simplicity, consider just the standard BM. Continuity of the paths, independence and stationarity of the increments remainunchanged under the rescaling. It remains to observe that • is normally distributed with mean 0 and variance • Remark. Rescaling is a transformation on the “functional space.” The scaling invariance property of BM identifies a transformation that changes the individual sample paths but preserves their distribution. Prof. Bob Li
Scaling drift-free random walk into drift-free BM • If there had been a million sample paths and each path had incorporated a thousand times more steps, the two small rectangles would look like the same distribution. This interprets Brownian rescaling as self similarity.
Stochastic self similarity This invariance property is a form of stochasticself similarity. The aforementioned process of repeating the rescheduling of random walk can be regarded as iterations of self similarity. Objects that keep a nontrivial geometric structure at all scalesprovide an approach to randomfractals.
Fractals • Randomize An island with fractal coastline. How long is this coastline?