Download
1 / 12
120 likes | 246 Vues
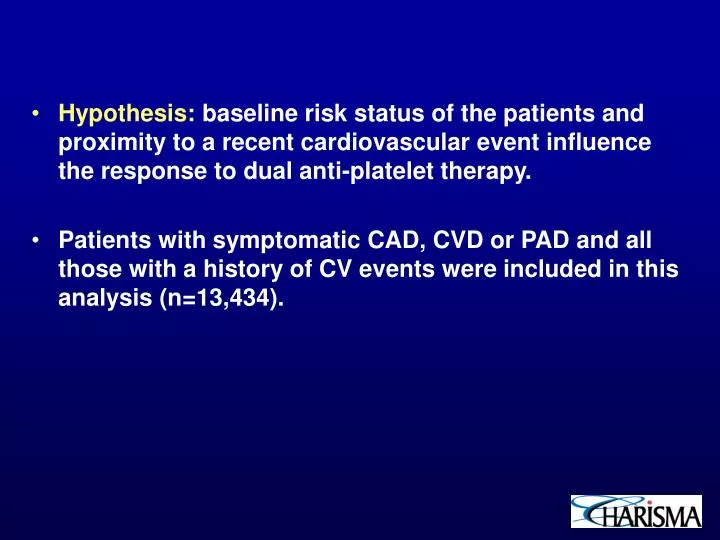
Hypothesis: baseline risk status of the patients and proximity to a recent cardiovascular event influence the response to dual anti-platelet therapy. Patients with symptomatic CAD, CVD or PAD and all those with a history of CV events were included in this analysis (n=13,434).

E N D
Hypothesis: baseline risk status of the patients and proximity to a recent cardiovascular event influence the response to dual anti-platelet therapy. • Patients with symptomatic CAD, CVD or PAD and all those with a history of CV events were included in this analysis (n=13,434).
How do we interpret the data? • Patients with documented vascular events, irrespective of inclusion group • Does baseline risk influence the treatment effect?
10 Placebo + ASA 8.8 % Clopidogrel + ASA 7.3 % 8 6 Primary outcome event rate (%) 4 RRR: 17.1 % [95% CI: 4.4%, 28.1%] p=0.01 2 0 0 6 12 18 24 30 Months since randomization Primary Endpoint (MI/Stroke/CV Death) in Patients with Previous MI, IS, or PAD“CAPRIE-like Cohort” N=9,478
Cardiovascular outcomes according to quartiles of baseline CV risk. Q4: severe bleeds: 3.1% C vs 3.2% P and ICH 1.0%C vs 1.0%P moderate bleeds 4.2%C vs 2.6% P, (p=0.02).
How do we interpret the data? • Patients with documented vascular events, irrespective of inclusion group • Does baseline risk influence the treatment effect? • The impact of proximity to a CV event
Cerebrovascular (n=4320) Cardiovascular (n=5835) PAD (n=2838) 12 Placebo +ASA (9.6%) 12 12 RRR: 13.9% p=0.130 RRR: 16.0% p=0.088 RRR: 13.1% p=0.285 Placebo + ASA (8.7%) 10 10 10 Placebo + ASA (7.4%) 8 8 8 6 6 6 Clopidogrel + ASA (8.1%) Clopidogrel + ASA (7.6%) Primary outcome event rate (%) Clopidogrel + ASA (6.5%) 4 4 4 2 2 2 0 0 0 0 6 12 18 24 30 0 6 12 18 24 30 0 6 12 18 24 30 Months since randomization Months since randomization Months since randomization Documented CV Disease Patients: Primary Outcome (MI/Stroke/CV Death) Median time from qualifying event to randomization: 23.3 months 3.5 months 23 months Bhatt DL, Fox KA, Hacke W, et al. N Engl J Med. 2006: 354; 1-12
12 10.8 p= 0.031 10 8.2 8 p= 0.06 Placebo percent 6 5.6 Clopidogrel 5.3 5 4 3.8 4 3.4 3.4 2.5 2 0 Death/MI/Stroke Death (all) CV death MI Stroke Enrolled within 6/12 of event
Proximity to a recent CV event (MI/stroke) was associated with significant benefit with clopidogrel. For those randomized within 6 months of MI or stroke, the frequency further MI/stroke or death was 8.2% C vs 10.8% P (HR 0.76, 95%CI 0.59-0.98, p=0.034). In those patients who had a documented prior vascular event or with confirmed PAD (n=9478) the risk of death/MI/stroke was 7.3%C vs 8.8%P (HR 0.83, 95% CI 0.72-0.96, p=0.01).
How do we interpret the data? • Primary outcome by categories of included patients • Patients with included with documented MI or ischemic stroke
Event rate over time for primary outcome in CAD patients with inclusion MI vs coronary inclusion criteria other than MI CAD patients with qualifying MI (N=3846) CAD patients without qualifying MI (N=1989) RRR [95%CI]: 22.6 % [2.2, 38.7] p = 0.031 RRR [95%CI]: -10.3 % [-58.0, 23.0] p = 0.593
Event rate over time for primary outcome in CVD patients with qualifying IS vs qualifying TIA CVD patients with qualifying IS (N=3245) CVD patients with qualifying TIA (N=1233) RRR [95%CI]: 22.0 % [2.4, 37.6] p = 0.029 RRR [95%CI]: -14.7 % [-74.4, 24.6] p = 0.520
Conclusions: • For the overall population the trend for benefit (7% RR) • was non-significant • Commencing therapy with clopidogrel within 6 months of • a stroke or MI suggests evidence of benefit on rates of • future death/MI/stroke. • Higher risk groups, including those with clear evidence of • vascular disease and recent vascular events, suggests • the potential for greater benefit