Download

1 / 15
150 likes | 153 Vues
Learn how probabilistic risk analysis and Bayesian networks can be used to evaluate and prioritize supply network disruptions. Discover different importance measures, such as Fussell-Vesely and Risk-Achievement-Worth, and how they can guide decision-making in supply chain risk management.

E N D
Importance measures in strategic-level supply chain risk management Anssi Käki Ahti Salo Department of Mathematics and Systems AnalysisSchool of Science, Aalto University, Finland
Introduction Diagnosis of risks and evaluation of riskmitigationstrategiesis difficult in largesupplynetworks: • Numerousnodes (suppliers, tiers) • Manyuncertainties (demand, quality, leadtime) • Highlevel of dependency (disruptions at supplier’ssupplier’ssupplier) WepresenthowsupplynetworkdisruptionscanbeevaluatedwithProbabilisticRiskAnalysis (PRA) and Bayesiannetworks : • How to recognize, group, and prioritizeriskfactors? • How to visualizerisks?
Executive summary Risk importance of each supplier illustrated Material supplier network for Honda Accord center console1 1 Network adapted from Choi and Hong (2002), Kim et al. (2011)
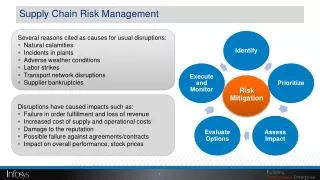
Why Probabilistic Risk Analysis (PRA) for Supply Networks? Review of optimization models for disruption management: Snyder et al. (2010) Supply chain risks can be captured with optimization models: • Stochastic optimization for minimizing expect cost under known probability distributions • Robust optimization for a guaranteed outcome without much assumptions of uncertainty • Tailored for specific decision situations: e.g, facility location or supplier selection Probability based diagnostic analysis serves different purposes: • Not focused on particular decisions; increases visibility and understanding of the whole • Allows modeling substantially large networks • Models are not ”black boxes” Comprehensible for management
PRA importance measures for prioritization: A Fussell-Vesely example 10% S1 10% S3 10% S2 10% 10% • Fussell-Vesely measures the decrease in network disruption probability, if a supplier is not disrupted S4 S5 Lower branch Upper branch 2.2%2.0% • Supplier S3 is the mostimportant, then S4 and S5, then S1 and S2 Probability of disruption at supplier i: Pr(Fi)= 10.0% Probability for network disruption: Pr(Fs)≈ 2.2%
Different importance measures are used to support different decisions • There are many importance measures for various purposes; we consider Fussell-Vesely (FV) & Risk-Achievement-Worth (RAW): • The directeffect of supplier i for the networkdisruptionFs • ”Defence in depth” - the capability of the network to resist a disruption at supplier i Source of table: van der Borst & Schoonakker (2001)
Bayesian networks can be used to model probabilistic reliability networks • Typical PRA methods use logic gates to describe a system; this can be too rigorous for supply chains • Bayesian network consists of a causality graphand conditional probability tables
The Honda Accord center console network The Accord net is translated into a Bayesian net Assumptions: • A leaf supplier has 5% disruption probability • Disruption at a parent supplier leaves a 50% ”survival probability” (due to backup suppliers, inventories) • The disruption probability of suppliers with multiple parents is proportional to amount of parents disrupted Importance measures are calculated for two scenarios: • As above • As above, but with supplier J3 turning risky Disruption probability is updated from 5% to 50%
Fussell-Vesely (no disruption at supplier): First tier suppliers are critical Scenario: J3 becomes risky For example: FV(JFC)=32.86%FV(Emhart)=1.01% Size and colorindicate the importancemeasurevalue
Risk Achievemet Worth (certain disruption): Parent supplier CVT is critical Scenario: J3 becomes risky For example: RAW(JFC)=3.37RAW(Emhart)=1.11 Size and colorindicate the importancemeasurevalue
Key takeways from different measures 1. 2. 3. Fussell-Veselyguides the prioritization of improvementactions at individualsuppliers • Improvements at 1st tiersuppliersCVTAss and JFCincreasereliability the most • WhenJ3hasreliabilityissues, improvements atJFC and J3become a keypriority RiskAchievement Worth canbeusedwhenimprovingnetwork (design, othersuppliers) • A disruption at CVT (parent of threeCVT-sub-suppliers) harmsreliability the most Decreasingdependency on CVT is recommended
Extensions of the approach Estimation of probabilities: • Expert judgment, estimation from statistical data, discrete-event simulation Dynamic modeling: • Inventory and delays work as supply chain buffers; they are dynamic in nature • Once-in-ten-years disruption that lasts 6 months vs. Once-a-year disruption that lasts 18 days Both have (yearly) disruption probability of 5% • Dynamic Bayesian nets and simulation can capture such dynamics Multi-stage models: e.g., ”Full disruption” – ”50% capacity” – ”Full capacity” Other importance measures, such as joint-importance
Conclusions Importance measures can be used for various purposes… • Fussell-Vesely when planning improvements at individual suppliers • Risk Achievement Worth for changes in network design …and the results can be illustrated in an intuitive risk map The approach is next validated in real applications
Thank you! References Choi, T. Y. and Hong, Y. (2002). Unveiling the structure of supply networks: case studies in Honda, Acura, and DaimlerChrysler. Journal of Operations Management, 20:469–493. Deleris, L. and Erhun, F. (2011). Quantitative risk assessment in supply chains: a case study based on engineering risk analysis concepts. In Planning production and inventories in the extended enterprise. Springer Science+Business Media. Kim, Y., Choi, T. Y., Yan, T., and Dooley, K. (2011). Structural investigation of supply networks: A social network analysis approach. Journal of Operations Management, 29:194–211. Schmitt, A. and Singh, M. (2011). A Quantitative Analysis of Disruption Risk in a Multi-Echelon Supply Chain. Working paper. Center for Transportation and Logistics. Massachusetts Institute of Technology. Snyder, L, Atan, Z., Peng, P., Rong, Y., Schmitt, A. and Sinsoyal, B. (2010). OR/MS Models for Supply Chain Disruptions: A Review. Working Paper. Van der Borst, M. and Schoonakker, H. (2001). An overview of PSA importance measures. Reliability Engineering and System Safety, 72: 241-245. Zio, E. (2011). Risk Importance Measures. In Safety and Risk Modeling and Its Applications. Springer-Verlag London.