Download
1 / 27
280 likes | 475 Vues
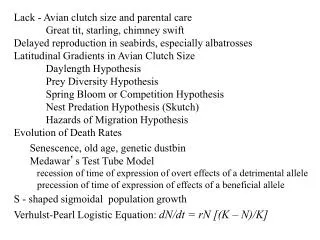
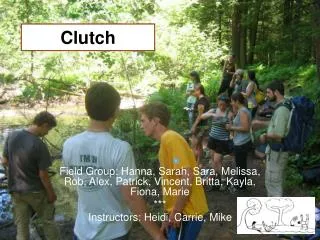
Latitudinal Gradients in Avian Clutch Size. Daylength Hypothesis Prey Diversity Hypothesis (search images) Spring Bloom or Competition Hypothesis Nest Predation Hypothesis (Skutch) Hazards of Migration Hypothesis Please study Handouts 1, 2, 3, and 4 in preparation for next Thursday’s exam.

E N D
Latitudinal Gradients in Avian Clutch Size • Daylength Hypothesis • Prey Diversity Hypothesis (search images) • Spring Bloom or Competition Hypothesis • Nest Predation Hypothesis (Skutch) • Hazards of Migration Hypothesis Please study Handouts 1, 2, 3, and 4 in preparation for next Thursday’s exam
Evolution of Death Rates, Senescence, old age, genetic dustbinMedawar’s Test Tube Model, Lactose intolerance Recession of time of expression of the overt effects of a detrimental allele Precession of time of expression of the positive effects of a beneficial allele Pearl-Verhulst Logistic Equation: Sigmoidal Population GrowthDensity Dependence versus Density Independence Density Dependent versus Density Independent Selection Equilibrium, Opportunistic, and Fugitive Species r-strategists versus K-strategists
Verhulst-Pearl Logistic Equation dN/dt = rN – rN (N/K) = rN – {(rN2)/K}dN/dt = rN {1– (N/K)} = rN [(K – N)/K] dN/dt = 0when [(K – N)/K] = 0 [(K – N)/K] = 0when N = K dN/dt = rN – (r/K)N2
Inhibitory effect of each individual On its own population growth is 1/K
At equilibrium, birth rate must equal death rate, bN = dNbN = b0 – x N dN = d0 + y N b0 – x N = d0 + y NSubstituting K for N at equilibrium and r for b0 – d0 r = (x + y) K or K = r/(x +y)
Derivation of the Logistic Equation Derivation of the Verhulst–Pearl logistic equation is easy. Write an equation for population growth using the actual rate of increase rN dN/dt = rN N = (bN – dN) N Substitute the equations for bNand dN into this equation dN/dt = [(b0 – xN) – (d0 + yN)] N Rearrange terms, dN/dt = [(b0 – d0 ) – (x + y)N)] N Substituting r for (b – d) and, from above, r/K for (x + y), multiplying through by N, and rearranging terms, dN/dt = rN – (r/K)N2
Density Dependence versus Density Independence Dramatic Fish Kills, Illustrating Density-Independent Mortality _______________________________________________________ Commercial Catch Percent ––––––––––––––––––––– Locality Before After Decline _______________________________________________________ Matagorda 16,919 1,089 93.6 Aransas 55,224 2,552 95.4 Laguna Madre 12,016 149 92.6 ________________________________________________________ Note: These fish kills resulted from severe cold weather on the Texas Gulf Coast in the winter of 1940.
Some of the Correlates of r- and K-Selection _______________________________________________________________________________________ r-selection K-selection ______________________________________________________________________________________________________________________________ Climate Variable and unpredictable; uncertain Fairly constant or predictable; more certain Mortality Often catastrophic, nondirected, More directed, density dependent density independent Survivorship Often Type III Usually Types I and II Population size Variable in time, nonequil- Fairly constant in time, ibrium; usually well below equilibrium; at or near carrying capacity of envi- carrying capacity of the ronment; unsaturated com- environment; saturated munities or portions thereof; communities; no recolon- ecologic vacuums; recolon- ization necessary ization each year Intra- and inter- Variable, often lax Usually keen specific competition Selection favors 1. Rapid development 1. Slower development 2. High maximal rate of 2. Greater competitive ability increase, rmax 3. Early reproduction 3. Delayed reproduction 4. Small body size 4. Larger body size 5. Single reproduction 5. Repeated reproduction 6. Many small offspring 6. Fewer, larger progeny Length of life Short, usually less than a year Longer, usually more than a year Leads to Productivity Efficiency Stage in succession Early Late, climax ________________________________________________________________________________________________________________________________
Frequencies of Positive and Negative Correlations Between Percentage Change in Density and Population Density for a Variety of Populations in Different Animal Groups ___________________________________________________________________ Numbers of Populations in Various Categories ____________________________________________ Positive Positive Negative Negative Negative Taxon (P<.05) (Not sig.) (Not sig.) (P<.10) (P < .05) Total ___________________________________________________________________ Inverts 0 0 0 0 4 4 Insects 0 0 7 1 7 15 Fish 0 1 2 0 4 7 Birds 0 2 32 16 43 93 Mammals 1* 0 4 1 13 19 Totals 1* 3 45 18 71 138 ___________________________________________________________________ * Homo sapiens (the “sap”)
Negative correlations between percentage change in density and population density for a variety of populations in different animal groups except for Homo the sap 4 and 10 year population “cycles” microtines and snowshoe hares Sunspot Hypothesis — dark tree ring marks Time Lags Stress Phenomena Hypothesis Predator-Prey Oscillations Epidemiology-Parasite Load Hypothesis Food Quantity Hypothesis Nutrient Recovery Other Food Quality Hypotheses Genetic Control Hypothesis – Optimal reproductive tactics Could optimal reproductive tactics drive population cycles?
Snowy owls Microtines: Voles and lemmings: 4 year cycles Fabled lemming marches into the sea
Population “Cycles” • Sunspot Hypothesis • Time Lags • Stress Phenomena Hypothesis • Predator-Prey Oscillations • Epidemiology-Parasite Load Hypothesis • Food Quantity Hypothesis • Nutrient Recovery • Other Food Quality Hypotheses • Genetic Control Hypothesis Bb:Read Krebs et al. “What drives the 10-year cycle of snowshoe hares?”