Download
1 / 50
560 likes | 818 Vues
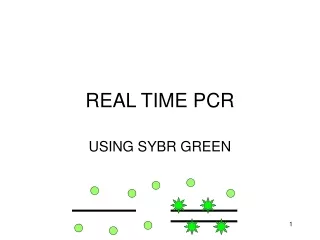
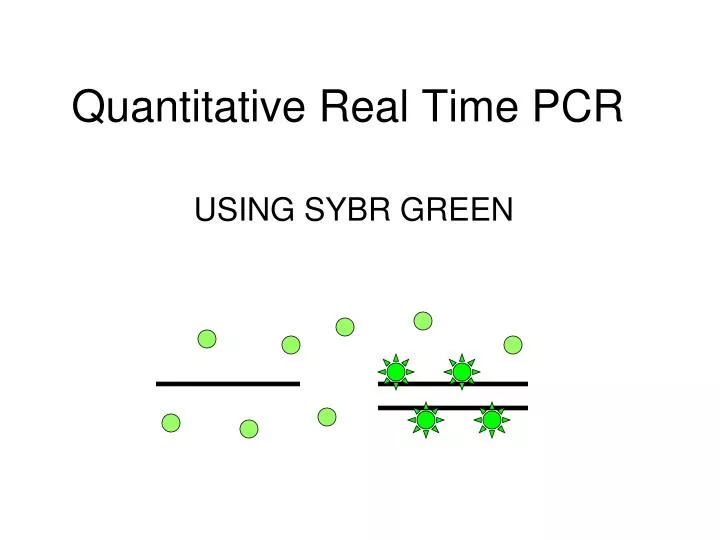
Quantitative Real Time PCR. USING SYBR GREEN. SYBR Green. SYBR Green is a cyanine dye that binds to double stranded DNA. When it is bound to D.S. DNA it has a much greater fluorescence than when bound to single stranded DNA. This can be used to follow the production of new PCR products.

E N D
Quantitative Real Time PCR USING SYBR GREEN
SYBR Green • SYBR Green is a cyanine dye that binds to double stranded DNA. • When it is bound to D.S. DNA it has a much greater fluorescence than when bound to single stranded DNA. • This can be used to follow the production of new PCR products emission excitation
THE PROBLEM • NEED TO QUANTITATE DIFFERENCES IN GENE (mRNA) EXPRESSION • SMALL AMOUNTS OF mRNA • LASER CAPTURE • SMALL AMOUNTS OF TISSUE • PRIMARY CELLS • mRNA FROM CHICKEN LIPS
THE PROBLEM • QUANTITATION OF mRNA • northern blotting • ribonuclease protection assay • in situ hybridization • PCR • most sensitive • can discriminate closely related mRNAs • technically simple • but difficult to get truly quantitative results using conventional PCR
Ratio target gene in experimental/control = fold change in target gene fold change in reference gene NORTHERN BLOT control expt 10X target gene internal control gene actin, GAPDH, RPLP0 etc 2X Corrected fold increase = 10/2 = 5
Normalization Standards- corrects for loading errors • same copy number in all cells • expressed in all cells • medium copy number advantageous • correction more accurate
Normalization Standards • The perfect standard does not exist • You have to determine which is best for your organism and questions
Standards • Commonly used standards • Glyceraldehyde-3-phosphate dehydrogenase mRNA (GAPDH) • Beta-actin mRNA • MHC I (major histocompatability complex I) mRNA • mRNAs for certain ribosomal proteins • E.g. RPLP0(ribosomal protein, large, P0; also known as 36B4, P0, L10E, RPPO, PRLP0, 60S acidic ribosomal protein P0, ribosomal protein L10, Arbp or acidic ribosomal phosphoprotein P0) • 28S or 18S rRNA
PCR The amount of DNA doubles after each cycle Assuming 100% efficient PCR reactions After n cycles there will be 2n times as much DNA
Arithmetic scale Logarithmic scale
Arithmetic scale PCR baseline subtracted RFU Cycle number
Logarithmic scale PCR baseline subtracted RFU Cycle number
Linear from ~20 to ~1500 Fluorescent Units Log scale PCR baseline subtracted RFU Cycle number
Linear ~20 to ~1500 Fluorescent Units Arithmetic scale PCR baseline subtracted RFU Same region as log scale Cycle number
Arithmetic scale PCR baseline subtracted RFU Cycle number SERIES OF 10-FOLD DILUTIONS OF TEMPLATE
Arithmetic scale SERIES OF 10-FOLD DILUTIONS
threshold Ct (Cp) Logarithmic scale SERIES OF 10-FOLD DILUTIONS
threshold = 300 Cycle Threshold - Ctis set during the linear part of the reaction
AFTER 1 CYCLE 100%= 2.00x 90% = 1.90x 80% = 1.80x 70% = 1.70x Much different values depending on the efficiency
AFTER 1 CYCLE 100%= 2.00x 90% = 1.90x 80% = 1.80x 70% = 1.70x AFTER N CYCLES: fold increase = (1 + efficiency)n Only 1% of 100% efficiency amount
Arithmetic scale Log scale
Lower Cycle thresholds show less error due to efficiency changes
Same slope = Same efficiency SERIES OF 10-FOLD DILUTIONS
Plot the Ct values for the dilutions vs. concentration, the slope of the line can be used to calculate the PCR efficiency
Melt curve analysis SYBR Green will bind to any double-stranded DNA. Primer-dimers will contribute to the signal too. How can you distinguish between amplification of the gene of interest and artifacts? Remember SYBR Green binds to double-stranded DNA but not single stranded DNA. You can ‘melt’ the newly created DNA and the SYBR Green will dissociate and the fluorescence decreases.
Melt curve analysis The key is that DNA of different base composition and length will ‘melt’ at difference temperatures. By slowly and accurately increasing the temperature there will be changes in the rate of the fluorescence decrease if there is more than one kind of DNA present. -d(RFU)/dT Temperature (deg C) Temperature (deg C) Raw melt-curve Derivative of melt-curve
-d(RFU)/dT Temperature, Celsius Melt curve analysis (derivative of fluorescence decrease as the DNA becomes single stranded)
The Melt-Curve shows the different types of DNA present Gene of interest -d(RFU)/dT Temperature, Celsius Primer dimer artifact (No template control)
Melt curve analysis can also be used for allelic discrimination Newer RT-PCR thermocyclers can perform High Resolution Melt Curve analyses Used for allelic discrimination analyses in populations
GENE EXPRESSION ANALYSIS OVERVIEW Obtain tissue extract RNA copy into cDNA (reverse transcriptase) real-time PCR analyze results
GENE EXPRESSION ANALYSIS OVERVIEW Obtain tissue Extract RNA Copy into cDNA (reverse transcriptase) Real-time PCR Analyze results
IMPORTANCE OF RNA QUALITY • Should be free of protein (absorbance 260nm/280nm > 1.8) • Should be intact (28S/18S ~2:1) • High RIN (use Agilent Bioanalyzer) • Should be free of DNA (treat with DNAse) • Should be free of PCR inhibitors • Purification methods • Clean-up methods
OVERVIEW Obtain tissue Extract RNA Copy into cDNA (reverse transcriptase) Real-time PCR Analyze results
Importance of reverse transcriptase primers • Oligo (dt) • Random hexamer (NNNNNN) • Gene Specific
REVERSE TRANSCRIPTION Taq pol • adds a bias to the results • efficiency usually not known RT mRNA cDNA qPCR
OVERVIEW Obtain tissue Extract RNA Copy into cDNA (reverse transcriptase) Real-time PCR Analyze results
Importance of primers in qPCR • specific • high efficiency • no primer-dimers • Ideally should not give a genomic DNA signal • cross exon/exon boundary
Primer will not bind to genomic DNA because the 3’ end is not complementary to the Intron F-Primer 3’ binding site F-Primer 5’ binding site R-Primer EXON 1 INTRON EXON 2 genomic DNA F-primer 3’-end will not bind R-Primer EXON 1 EXON 2 cDNA F-Primer Primer will bind to the cDNA because the primer is complementary to the Exon-Exon boundary after the intron is cleaved out
How will you measure the PCR product? • Directly • SYBR Green • Quality of primers critical • Indirectly • In addition to primers, add a fluorescently labeled hybridization probe • Many different approaches to this, see Bustin J. Mol. Endocrinol. (2000) 25:169
Importance of controls • Negative control (no DNA) • checks reagents for contamination • No reverse transcriptase control • detects if signal from contaminating DNA • Positive control • checks that reagents and primers work • especially importance if trying to show absence of expression of a gene
RNA from control cells cDNA from control cells RNA from treated cells cDNA from treated cells Is there any change in your gene expression?
RNA from control cells cDNA from control No RT* for control (to see if any genomic DNA signal ) RNA from treated cells cDNA from treated cells No RT for treated cells (to see if any genomic DNA signal ) Is there any change in your gene expression? *RT - Reverse Transcriptase
qPCR Data Analysis • Depends on the goal of the experiment— • Absolute quantification allows actual copy numbers to be determined but is labor intensive. • Comparative quantification determines relative abundance rather than exact copy. • Most often used for gene expression studies and has two main options for quantitation: • ΔΔCt and standard curve quantitation.
Absolute quantification A standard curve is generated using a single template species that is diluted over several orders of magnitude. Ct (Cp) vs concentration is plotted.
Standard curve generation – template choice • DNA standards—PCR amplicon of the target of interest, or plasmid clone containing the target of interest • Pros: Easy to generate, quantify, and maintain stability with proper storage.Cons: Avoids the reverse transcription phase of qRT-PCR, which can impact reaction efficiency significantly. • RNA standards—In vitro–transcribed RNA of the target of interest • Pros: Incorporates RT efficiency and mimics the target of interest most similarly.Cons: Time-consuming to generate and difficult to maintain accuracy over time due to instability.
Comparative quantification – ΔCt method Most basic form is to obtain a Ct value for the gene of interest and a calibrator sample (such as time zero sample). The difference is the ΔCt Fold difference = 2ΔCt This basic method does not incorporate a normalizer or corrects for efficiency. It assumes that the same amount of template was present and the amplification efficiency is the same.
Comparative quantification – ΔΔCt method An improvement over ΔCt is the ΔΔCt method Fold difference = 2–ΔΔCt e.g. Time zero
Comparative quantification – standard curve method Fold difference = (Etarget)ΔCt target /(Enormalizer)ΔCt normalizer E = efficiency from standard curve E = 10[-1 /slope] ΔCt target = Ct GOI c - Ct GOIs ΔCt normalizer = Ct norm c- Ct norms Starting quantity (pg total RNA)
References: • Several pdfs for this talk are available at: • http://botany.okstate.edu/resources/pcr_core.html • Another good website with loads of information: • http://www.gene-quantification.de/ Any Questions?