Download
1 / 32
320 likes | 444 Vues
The 2012 Corn Predicament. Daryll E. Ray and Harwood D. Schaffer University of Tennessee Institute of Agriculture Agricultural Policy Analysis Center. National Packing Meeting United Food and Commercial Workers Chicago, Illinois August 15, 2012. The Situation.

E N D
The 2012 Corn Predicament Daryll E. Ray and Harwood D. Schaffer University of Tennessee Institute of Agriculture Agricultural Policy Analysis Center National Packing Meeting United Food and Commercial Workers Chicago, Illinois August 15, 2012
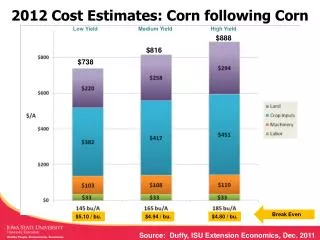
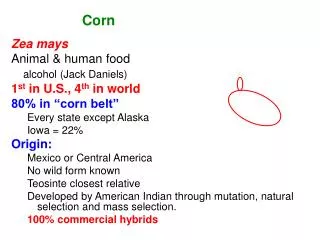
The Situation Most wide-reaching drought since 1956 Hottest July on record dating back to 1895 Corn yield by USDA as of Aug. 10 Down 16% from last year’s reduced yield Down 25% from more normal yield three years ago, 2009 Corn production projected to be lowest since 2006
Want to do Three Things Visually put the corn “The Situation” into historical perspective No Reserve? What is the deal with that? Haven’t we, and other countries, had reserves programs in the past? What if commodity programs between 1998 and 2010 had been replaced with a “reserve program?” (NFU study)
Corn Yield Bushels/Acre -41 Bu. -25% -24 Bu. -16% -35 Bu. -29% -32 Bu. -28%
Corn Yield and Production Bushels/Acre Mil. Bu. 88 12 83 Yield -16% -13% -28% -49% -29% -31% Production
Corn ProductionUtilization and Reserves Mil. Bu. Utilization Production Reserves (CCC and FOR)
Corn Price & Reserves Mil. Bu. 71 77 96 Price Reserves
Corn Price and Feed Demand Mil. Bu. Feed Price
Reserves Are Not a New Idea • Egypt • 1750 BC • Biblical story of Joseph and Pharaoh • 7 fat years followed by 7 lean years • China • Beginning in 54 BC • Had its ups and downs over period of 2,000 years • “Constant Normal Granary” • China currently holds large stocks for domestic needs
US Experience • United States • 1929-1996 AD • Federal Farm Board – stock holding in attempt to stabilize price • Commodity Credit Corporation • Stabilize price • Ever Normal Granary • Manage supply • Factors that brought reserves into disrepute • Inconsistent management or mismanagement by those who did not believe in rationale for reserves and price stabilization • Dumping of excess on world market
Arguments Against Reserves • Commercials argued they would provide reserves • Government “interference” not needed • Not to worry • Free trade will guarantee availability from one country or another • Too expensive • Procurement and storage costs are too costly • Requires a large physical stock
Argument Analysis Assertions not always true Commercials have no incentive to hold stocks Supply disruptions can affect more than one supplier in a given year One has to compare costs of storage against a no-reserve alternative Presence of reserve stocks calms market behavior Overriding Issue: Countries view food as a national security issue
Reserve Objectives • Prevent crises: • Consumer price and availability crises • Producer crises (livestock producers when prices are “high;” followed by extraordinary low crop prices for crop farmers) • The objective is NOT to fix prices • But to work with the market to ameliorate impacts of extreme price fluctuations • Food availability/food prices • Severe economic disruptions • Environmental damages
A Market Directed Inventory System(MDIS) Daryll E. Ray and Harwood D. Schaffer Agricultural Policy Analysis Center University of Tennessee Institute of Agriculture National Farmers Union February 29, 2012
Policy Description Objectives • Bulk of revenue from market receipts • Reduce government payments while maintaining farm income • Reduce price volatility
Policy Description MDIS Specifications for 1998-2010 Study Period • Initial corn loan rate set at midpoint between variable and full cost of production • Indexed with a prices paid by farmers index • Other crop loan rates set to historic ratios with corn • Release price is set at 160% of loan rate
Policy Description MDIS Specifications for 1998-2010 Study Period • MDIS maximums • Corn – 3 billion bushels • Wheat – 800 million bushels • Soybeans – 400 million bushels • Farmer storage payment rate 40¢/bu./yr • Set-aside available if needed • Eliminate Direct Payments, LDPs, & CCPs
8 Crops - Government Payments $ Billion Historic Baseline $152 Billion (Total 1998-2010) MDIS $56 Billion
8 Crops – Government PaymentsAverage Per Year Over Each Period $ Billion Historic Baseline $14.8 $11.7 MDIS $6.8 $4.8 $4.3 $3.6
Corn Prices Release Price MDIS Historic Baseline Loan Rate
Corn PricesAverage Per Year Over Each Period $4.02 $3.71 MDIS Historic Baseline $3.07 $2.81 $2.68 $2.05
Corn Exports - Quantity Million Bu. Historic Baseline MDIS
Corn Exports - Value $ Billion MDIS Historic Baseline
Corn Value of ExportsAverage Per Year Over Each Period $ Billion $8.3 $7.7 MDIS Historic Baseline $5.9 $5.6 $4.8 $3.9
MDIS Stocks Million Bu. Corn Wheat Soybeans
Corn – Value of Production plus Government PaymentsAverage Per Year Over Each Period $ Billion $51.5 MDIS $46.5 Historic Baseline $36.1 $35.2 $28.2 $26.4
Realized Net Farm IncomeAverage Per Year Over Each Period $ Billion Historic Baseline MDIS $55.8 $51.1 $50.8 $51.5 $49.8 $52.1
Summary of Findings Over the Study Period, 1998-2010, with MDIS in Place: • Government payments 60% lower • Increased reliance on market receipts • Value of exports $4.9 billion higher • Lower price volatility benefitting: • Consumers • Crop farmers • Livestock producers and industrial users
Weekly Policy Column To receive an electronic version of our weekly ag policy column send an email to: dray@utk.edu requesting to be added to APAC’s Policy Pennings listserv
Corn Feed FSI Exp 1,000 Bu. Feed Food, Seed, Industrial Exports