Download
1 / 15
150 likes | 281 Vues
Tara Jensen for DTC Staff 1 , Steve Weiss 2 , Jack Kain 3 , Mike Coniglio 3 1 NCAR/RAL and NOAA/GSD, Boulder Colorado, USA 2 NOAA/NWS/Storm Prediction Center, Norman, Oklahoma, USA 3 NOAA/OAR/National Severe Storms Laboratory, Norman, Oklahoma, USA.

E N D
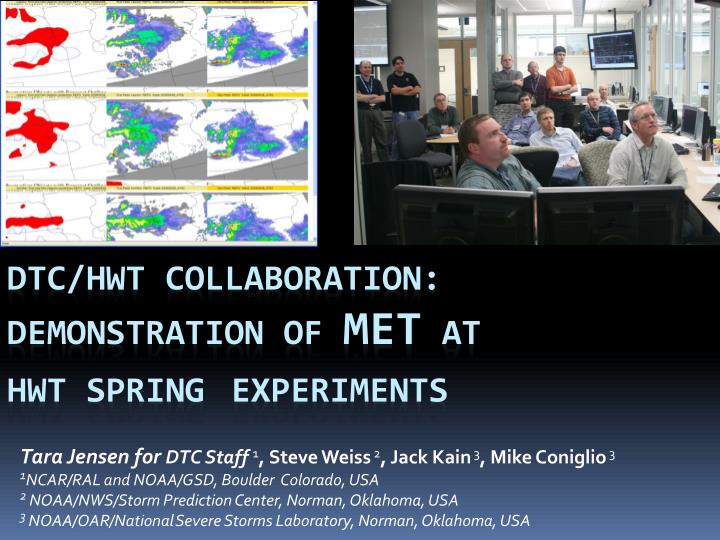
Tara Jensen for DTC Staff 1, Steve Weiss 2, Jack Kain 3, Mike Coniglio 3 1NCAR/RAL and NOAA/GSD, Boulder Colorado, USA2 NOAA/NWS/Storm Prediction Center, Norman, Oklahoma, USA3 NOAA/OAR/NationalSevere Storms Laboratory, Norman, Oklahoma, USA DTC/HWT Collaboration:Demonstration of MET atHWT SpringExperiments
What is HWT? BRINGING RESEARCHto FORECAST OPERATIONS NOAA National Severe Storms Lab (NSSL) NOAA Hazardous Weather Testbed (HWT) NOAA Storm Prediction Center (SPC) Cooperative Institute forMesoscale Meteorological Studies (CIMMS) The mutual interests of forecasters from the SPC, researchers from NSSL, and collocated joint research partners from CIMMS inspired testbed formation.
What is Spring Experiment? Goal: Give forecasters first-hand look at the latest research concepts and products Immerse researchers in the challenges, needs, and constraints of front-line forecasters Approach: Forecast teams gather in Norman each week from late April to early June. Each day consists of: Daily Briefing Review of Previous Day’s Forecast Selection of Current Day’s Forecast Area Forecasters split into 2 teams to predict Chance of Severe Wx between 20 UTC – 04 UTC(two periods 20-00 UTC; 00-04 UTC) Years 2000 2004 2001 2005 2002 2007 2003 2008 2009
DTC Collaboration with HWT Spring Experiment– BRINGING RESEARCH to FORECAST OPERATIONS 2008: Demonstration and first on-line system Goal: Demonstrate use of objective metrics in Spring Experiment format 2009: Expanded evaluation withresults in real-time Goal: Assess impact of radar assimilation on forecast
Forecast F H M Observation Grid-Stat - Traditional Vx Statistics for Dichotomous Variables Including: • Frequency Bias • Gilbert Skill Score • Critical Success Index • PODy • FAR MODE – Spatial Vx • Once Objects are Identified: • Traditional Stats may be calculated • Properties of the objects may also be calculated, including: • Intersection Area, Area Ratio, Centroid Distance, • Angle Difference, Percent Coverage, Median of Maximum • Interest, Intensity Quartiles
FcstVars: 1-hr accum. precipitation forecasts • Models: 2 high-resolution models • EMC-WRF 4km (NMM) • NSSL-WRF 4km (ARW) • Obs: NEXRAD Stage II QPE • User Interface: • Available toward end of Experiment • Traditional stats aggregated by Day, Threshold, Lead Time • Spatial stats (MODE output) available for each day • DTC Participation: 2 people attended Experiment for a week 2008 Preliminary Results
Traditional – Gilbert Skill Score Results were aggregated over Spring Experiment time period and the median value was calculated 0-12 hours NSSL slightly higher skill for lead times 0-12 hours. 12-36 hours Light precip: EMC exhibits slightly greater skill Heavier precip: NSSL model has greater skill Maximum Skill Skill appears to be peak between 8-12 hours for lighter precip and 5-6 hours for heavier precip Gilbert Skill Score (Equitable Threat Score) Measures the fraction of forecast events that were correctly predicted, adjusted for hits associated with random chance
Forecast Observed 1 1 3 3 2 2 Case Study:11 June 2008 Fcst: NSSL –ARW f025 1-hr accumulated precipitationObs: NEXRAD Stage 2 1-hr precipitation estimate MODE Spatial Scores
FcstVars: Composite Reflectivity; 1-hr accum. precipitation forecasts • Models: 3 high-resolution models • CAPSCN (SSEF 4km ensemble member - ARW core – radar assimilation) • CAPS C0 (SSEF 4km ensemble member - ARW core – no radar assimilation) • HRRR 3km – (ARW core - radar assimilation) • Obs: NSSL-NMQ Q2 QPE and Composite Reflectivity Products • User Interface: • Tailored around HWT specifications and displays • Trad. and Spatial Statistics available for individual forecast runs • MODE graphical output place into a multi-panel looped display • DTC Participation: 1 person on-site each week; provided short tutorial on MET and how to interpret results 2009 Preliminary Results
System developed for HWT collaboration Pulls in files Runs MET using pre-defined configurations Loads database with MET output Generates static graphics for website Prototype Interactive Evaluation Tool in development Prototype Database and Display System Static Graphics Display Forecast and Obs Run MET Grid-Stat MODE Database of MET output Prototype Interactive Display
14 May 2009 Init: 00 UTC MODE - Radius: 5 (20km); Thresh: 30dBZ
2009 Preliminary Results from Grid-Stat Gilbert Skill Score F00-F03: Assimilation – clear improved skill during f00-f03 even though skill is decreasing over this period. F04 and beyond – skill trends for both models are similar regardless of initialization, suggesting model physics dominates. This is consistent with the idea that it takes 5-6 hours to spin up a model from cold start.
Summary Overall: The Objective Verification provided by HWT/DTC collaboration has a been a very positive addition to the Spring Experiment process. 2008 Preliminary Results: Over 36 hours - There is no “clear winner” between EMC-4km and NSSL-4km. It appears each model excels during different parts of that forecast cycle 2009 Preliminary Results : Radar assimilation appears to improve skill scores in the first few hours, however it provides diminishing returns on improvement after this. No radar assimilation forecast closes the skill gap between hours 4-6, supporting the subjective evaluation that it takes 4-6 hours for a model to spin up from a cold start.