Download
1 / 25
250 likes | 363 Vues
Alternative inflation rate and model development project. Research Report By Gubad Ibadoglu , Economic Research Center, Caspian Plaza, May 19, 2010. PRESENTATION CONTENT. 1. 2. 3. 4. 5. Research agenda Survey methodology Alternative inflation results Determinants of inflation

E N D
Alternative inflation rate and model development project Research Report By GubadIbadoglu,Economic Research Center, Caspian Plaza, May 19, 2010
PRESENTATION CONTENT 1 2 3 4 5 • Research agenda • Survey methodology • Alternative inflation results • Determinants of inflation • Forecasting • Conclusions.
PROJECT OVERVIEW 1 2 3 4 5 NAME OF THE PROJECT: • Alternative Inflation Rate and Model Development GOALS & OBJECTIVES • The project proposed here includes the calculation of Monthly Consumer Price Indices using the methodologies and weights derived in the preceding project. The products of this project will be • determination of the most appropriate calculation and forecasting methods for inflation, • preparation of an alternative inflation model for use by government agencies, • publication through a media campaign • popularization of the “family inflation calculator”( www.inf.erc-az.org) in the center’s web-site that can be used by families themselves to calculate inflation rate for their own families.
METHODOLOGY 1 2 3 4 5 RESEARCH APPROACH: PROJECT DESIGN • Testing for New Keynesian Phillips Curve, ARIMA, Restricted and Unrestricted VAR; • A combination of random, systematic and stratified sampling; • Defining preliminary sampling units, the distribution of respondents among regions, • and a stratification based on the size of the firm; • Training sessions for survey conductors; • Administering the survey over 9 economic regions; • Entering survey results in machine-readable form; • Analyzing the findings of the survey; • Preparing final research report.
In the framework • of the project: • Inflation rate is calculated every month, on the basis of the information on • 51 480prices • The survey covers 9 economic regions of Azerbaijan • The survey is carried out in 22cities/towns and districts • Price monitoring includes a range of 586products Survey geography
Research design 1 2 3 4 5
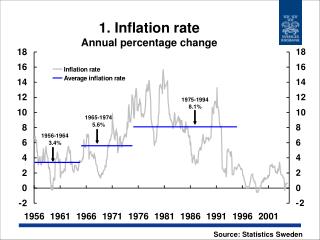
I. Consumer Price Index 1 2 3 4 5 According to the information released by State Statistics Committee, inflation for first four months were 0.5, 1.1, 1.3 and 0.0 percent respectively.
Consumer Price Index 1 2 3 4 5 CPI compared to the corresponding month of the previous year CPI compared to the corresponding period of the previous year According to the information released by State Statistics Committee, inflation for respective four periods were 1.8, 2.8, 3.8 and 4 percent respectively.
Minimum consumer basket (MCB) 1 2 3 4 5 Cost of MCB for different consumer baskets With the decree of the Parliament, the living minimum wage is set to 87 AZN, 96 AZN for labor force, 68 AZN for retired and 72 AZN for children.
1 2 3 4 5 II. Methodology of the research on CPI’s determinants The vector autoregressive (VAR) model is commonly used for forecasting systems of interrelated time series and for analyzing the dynamic impact of random disturbances on the system of variables. The VAR approach sidesteps the need for structural modeling by treating every endogenous variable in the system as a function of the lagged values of all of the endogenous variables in the system.
Structure of the Research • Using monthly data from January, 2000 – December, 2009 we estimated a VAR(5)and VAR(1) for the I(0) variables CPI, exchange rate, price of industrial products and M2. The output is large because involves estimating 4 equations with 5 lags for each variable, i.e. 20 parameters each plus the constant: 21x4=84 parameters.
Research results • It can be noted that CPI depends on previous CPI data and as deep as lag extend the dependence decreases. For example, 1 point growth in CPI in a lag before causes 1.6 point growth in CPI. • But exchange rate of AZN negatively impact on CPI and 1 percent growth in exchange rate in a lag before diminishes CPI 0.66 percent. As lag moves deeper dependence rate between CPI and exchange rate fluctuates. • It is notable that relation between M2 and CPI embodies in our equation so lame. 1 unit increase in money supply accelerate the CPI 0.003 unit. • The price of industrial products has certain influence on CPI. For instance, 1 unit growth of industrial index cause CPI to move up 0.03 unit.
Determinants of CPI Exchange rate Price index of industrial products CPI Money Supply CPI – A lag before Positive impact Negative impact
III. Forecasting Methodology • New Keynesian Phillips Curve • ARIMA • Restricted and Unrestricted VAR
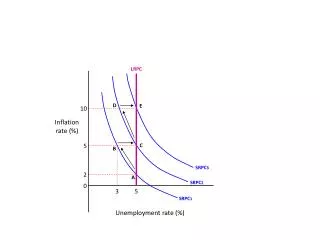
Classical, New and Hybrid Phillips curvesfor Azerbaijan (2003-2009) 1 2 3 4 5
Classical, New and Hybrid Phillips curvesfor Azerbaijan (2003-2009) 1 2 3 4 5 • Classical Phillips Curve • The estimation of classical Phillips curve shows that there seems no tradeoff between inflation and unemployment as the latter is statistically insignificant • Replacing unemployment with lagged values of output gap also emphasize the irrelevance of gap measure in causing inflation pressure. • New Phillips Curve • Following Gali and Gertler (1999) and Gali and Lopez-Salido (2001), we also estimated New Keynesian Phillips curve with inflation expectation and gap measure. Here as well, the output gap is appeared to be insignificant. • We also run regression with inflation expectation and unit labor cost in place of marginal cost as in the original New Keynesian Phillips curve. It is also interesting that marginal cost measure does not exert inflationary pressure. • Hybrid Phillips Curve • The estimation of Hybrid Phillips curve is also undertaken. As in the previous cases, though inflation expectation and lagged inflation are meaningful in explaining inflation, the marginal cost measure turned to be insignificant Classical Phillips Curve New Phillips Curve Hybrid Phillips Curve
Implications 1 2 3 4 5 • Above listed output results obviously show that both inflation persistence and inflation expectation are significant factors in the determination of inflation. It is worth to note that they enjoy the similar power in the formation of inflation. • The estimation results put forward that the output gap is not a significant factor in the shaping of inflation. • This result has various possible explanations: (i) the output gap measured uses GDP which excludes imports though inflation measure is calculated using CPI which includes imports. It seems that inflation springs from price movements of imported goods. It appears as a plausible explanation for the imported goods enjoy higher share in the consumer basket (ii) another explanation might be based on the institutional factors, market structure and monopolist behavior prevalent in the market. • Though Phillips curve are frequently appealed to forecast future inflation, it is not practicable in our case as the estimation output provides evidence against the existence of significant Phillips Curve relation.
Using ARIMA to Forecast Inflation 1 2 3 4 5 • One of the forecast methods of inflation is to invoke Box-Jenkins methodology. • In this literature, the appropriate data generating process (DGP) of the variable of interest is determined. That is, either AR or MA or ARMA. • When DGP of the variable of interest is examined during 2005-2009, the most appropriate form is AR (1) process for inflation. Note that represents inflation, sd shows the respective seasonal dummy.
Theoretical Framework for Forecasting 1 2 3 4 5 Model assumes three markets in the economy: goods and services, foreign exchange and money markets. Economy is in equilibrium if all three markets clear. • Aggregate demand for goods and is a function of the real money balances, the nominal exchange rate. It is assumed that the goods market is always in equilibrium. • In the foreign exchange market, flow demand for foreign exchange is a function of real exchange rate and real income. Foreign financing is exogenously given and as real income is fixed at the level of aggregate supply, the real exchange rate movements determine equilibrium in the market. • Money demand is assumed to be a function of real income and money supply is given exogenously. Since real income and money supply is exogenous, real money balances ensures equilibrium in the market. If the foreign exchange and money market are in equilibrium, goods and services market will also clear by the application of Walras law.
An Unrestricted Vector Autoregressive Model 1 2 3 4 5 A VAR allows a more model-based approach that should be better able to identify shocks that may trigger turning points in inflation. In the formulation of inflation model in Azerbaijan, each variable – prices (CPI), narrow money (M2) and nominal effective exchange rate (ER), non-oil real GDP- is treated symmetrically This structure of the system allows for feedback among variables, that is, past values of each variable are incorporated in each equation describing the data generating process (DGP) of a time series.
An Restricted Vector Autoregressive Model Sequential elimination of regressors (SER) strategy is used which sequentially deletes those regressors which lead to the largest reduction of the given criterion until no further reduction is possible. The structural equation for inflation can be shown separately as follows: where denotes the seasonal dummy for the ith month. Subset model only reveals the significant seasonal effect during summer months and in the beginning of the year.
Inflation forecasting results* *Weighted average inflation forecast for the end of 2010 is 8.3%
IV. Conclusion 1 2 3 4 5 • According to the model the monetary policy has low effect on CPI; • Inflation expectation is the most influential factor on CPI; • Fixed exchange rate is the subject to be discussed; • Weighted average inflation forecast for the end of 2010 is 8.3%.
Orta çəkili göstəriciyə görə 2010-cu ildə 8,3 faiz inflyasiya olacaq. THANK YOU 1 2 3 4 5 ECONOMIC RESEARCH CENTER Baku, Azerbaijan AZ1065 JafarJabbarli 44, Caspian Plaza 3, floor 9 Phone: (+99412) 437 32 30 Fax: (+99412) 437 32 40 E-mail: erc-az@azeurotel.com www.erc-az.org