Download
1 / 61
610 likes | 810 Vues
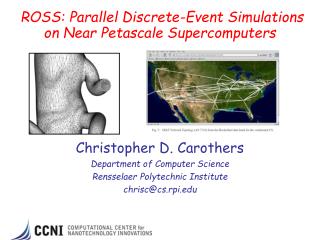
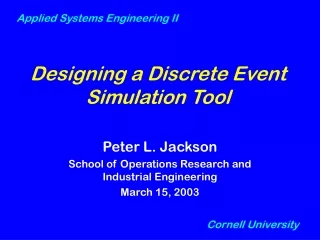
Designing, implementing, running and analyzing simple discrete-event simulations. We begin with the description of a very simple simulation environment - similar to the one described in Ch. 1 of Law & Kelton, or to a very simple version of the Arena environment.

E N D
Designing, implementing, running and analyzing simple discrete-event simulations.
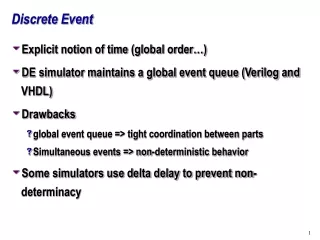
We begin with the description of a very simple simulation environment - similar to the one described in Ch. 1 of Law & Kelton, or to a very simple version of the Arena environment. All are discrete-event simulators (time and state variables change when events occur rather than the way normal time changes continuously) that we can use to simulate the behavior of many systems corresponding to single-server queues. We are all familiar with single-server queues: a bakery with one employee behind the counter; a barbershop with one barber; a train station with a single ticketing window; a banking machine. We should be able to (and will) modify the simulator to handle multi-server queues (add more bakery employees, more barbers, etc.) without too much trouble. What kind of questions are we going to ask?
1) how many customers will, on average, be in the queue? 2) how long will they, on average, have to wait in the queue? 3) what are realistic arrival and service disciplines - what kind of arrival rules will the customers follow; what kind of rules will the service provider follow? 4) can we test our choices of arrival and service disciplines against reality? 5) do the simulation results match reality? All of these are rather difficult questions - we will spend the rest of the course trying to provide some answers, or, at least, ways to attempt to provide some answers…
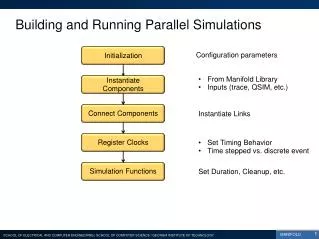
A pictorial representation: how can we think of a timeline of events? arrivals service times time line event times
What do we need to represent? • System State: the collection of all those (state) variables that describe the system at one particular time. • Clock: the variable that keeps the current value of the simulation time. • Event List: a list containing the next time an event will occur. • Statistical Counters: variables used to store statistical information. • Initialization Code: a routine that sets up the initial state of all the system variables. • Time advance routine: finds the next event and updates the Clock. • Event Management: each type of event has its own routine, to be run when he event takes place. This will usually generate some later events.
Library Routines: functions that are used to generate events with prescribed statistical properties; numerical codes; symbolic manipulation codes (e.g., closed form integration and differentiation modules, eigenvector and eigenvalue modules, etc.). • Report Generator: presents the final results in a usable manner. • Main module: invokes initialization and set up, and then starts the loop that will retrieve the next event and execute the appropriate event routine. The idea is not very complicated - the real problem for the simulation environment designer is to provide a user interface that will allow for the easy and convenient selection and matching of modules with desired characteristics.
Many of the variables will be represented by fairly complex structures (records): for example a server will have, as a minimum a status identifier - busy or idle - plus whatever other attributes are appropriate to it. For example, some bakery employees are faster than others so the service rate may well vary as we change servers; this is not a problem that will arise in a single server queue - where the service discipline is chosen at the beginning of the run and is not changed until the next run - but which should be kept in mind by any software engineer who hopes to write a fairly general simulation environment (we will see how Arena deals with some of these problems).
A Single-Server Queuing System. customer being served customers in queue departing customer arriving customer server If we use ti to denote the time of arrival of the i th customer, the time interval Ai = ti - ti-1 is called the i th interarrival time. A common assumption is that the interrarrival times are independent and identically distributed (have the same probability distribution). The service times will be denoted by S1, S2,…, Sn,… A usual starting state is that of an empty queue and an idle server.
Since every simulation is constructed because we want to know something, what is it that we want to know? That question is not sufficiently detailed: a preliminary question has to be WHO WANTS TO KNOW? There are at least three "people" involved: a) The customer. The customer's interest is the length of time required between entering the queue and starting to be served, or the "average service delay". b) The server. The server's interest is the percentage of total time spent actually serving. A bakery employee who spends eight hours serving customers non-stop is likely to be overworked.
c) The manager of the service. This person needs to know much more. The average service delay could be used to understand when customers will start using another baker because the wait is unacceptable. The server's busy time percentage might alert her to the possibility that the employee will start looking for an easier job. The average length of the queue might exceed fire code maxima for the number of people in the store, bringing the police around; or may just cause enough congestion so that the customer's experience will be sufficiently unpleasant to cause a switch to another baker, even though the average wait might be within acceptable limits. All together there are at least three quantities we must provide.
Let n denote a number of customers. D1, D2,…, Dn denotes the delay each customer experiences: the amount of time passed between entering the queue and being served. We would like to know the average (or expected) customer delay over runs of, say, n customers. We denote this quantity by d(n). Since there is no real way of obtaining this value - if the model is simple enough, or specialized enough, we might be able to bring enough mathematics to bear, but realistically complex models do not usually provide us with this option - we will estimate it from runs of our model (or actual observations of a specific bakery). To distinguish the estimator from the actual quantity, we will use a "hat" on the estimator: Each run of the model will provide us with a sample value. Standard statistical techniques will allow us to estimate d(n) with specified confidence from an adequate number of runs.
The example that follows consists of a system with customer arrivals and departures (completions of service) given by: e7= 3.8 e11= 3.8 e1= 0.4 e2= 1.6 e3= 2.1 e8= 4.0 e10= 5.6 e12= 7.2 e6= 3.3 e4= 2.4 e5= 3.1 e9= 4.9 e13= 8.6 = T(6) Where T(6) corresponds to completion of the sixth delay (beginning of service for the sixth customer). We will compute the various estimators, starting from the Average Delay. We have: D1 = 0 D2 = 2.4 - 1.6 = 0.8 D3 = 3.1 - 2.1 = 1.0 D4 = 0 D5 = 4.9 - 4.0 = 0.9 D6 = 8.6 - 5.6 = 3.0
Let q(n) denote the average number of customers in the queue - not being served - taken over the time interval from t = 0 to the time the nth customer begins being served (n delays have been experienced). Time is a continuous quantity, so this will require a different approach. For any particular run of the system, let Q(t) be the number of customers in the queue at time t. This is an integer-valued function of t ≥ 0. Let T(n) be the time required to observe n delays (the beginning of service for the nth customer) in the queue. If we let pi denote the expected proportion (probability) that Q(t)= i, then a reasonable definition of q(n) would be: the first moment (expected value) of the queue length distribution. Since all of these quantities are unknown, we must estimate them from actual (real or synthetic) data.
An estimator for the desired quantity would then be: If Ti denotes the total time during a simulation when the queue if of length i, with T(n) the total time of the simulation, then, Since values of Ti and T(n) can be computed from each run, we have the desired estimator.
Q(t) (size of queue), arrival times and departure times for a realization of a single-server queueing system. (Law & Kelton, Fig. 1.5) T(6) denotes the time of completion of the sixth delay (begin service for sixth customer). Q(t) 3 2 1 0 1 2 3 4 5 6 7 8 9 e7= 3.8 e11= 3.8 e1= 0.4 e2= 1.6 e3= 2.1 e8= 4.0 e10= 5.6 e12= 7.2 e6= 3.3 e4= 2.4 e5= 3.1 e9= 4.9 e13= 8.6 = T(6)
From the picture on the previous slide, we can compute the values Ti (the amount of time the queue has size i) T0 = (1.6 - 0.0) + (4.0 - 3.1) + (5.6 - 4.9) = 3.2 T1 = (2.1 - 1.6) +(3.1 - 2.4) +(4.9 - 4.0) +(5.8 - 5.6) = 2.3 T2 = (2.4 - 2.1) +(7.2 - 5.8) = 1.7 T3 = (8.6 - 7.2) = 1.4 Ti = 0 for all i >= 4.
The third estimator has to do with the percentage of time the server is busy. One may have an application in which the server should be busy all the time it is in operation, or one may have an application where the server can be fully busy over periods of time, but should have, at least on average, some random "rest time". An Internet switch could be an example of the first - any idle time cannot be charged to someone, and the switch is not going to complain. A human being could be an example of the second one. In a different domain, an automobile engine would be an example of the second: it is designed to operate at its maximum speed for only short periods of time; it is designed to operate at a lower "cruising speed" for long periods. Cars that claim equality for the two have simply found a way - through materials, design and manufacturing (and you pay for them) - to achieve a higher cruising speed while stopping the user from forcing the engine to run faster.
Let u(n) denote the server utilization - the proportion of the time (probability) that the server is busy. Since we have to live with an estimator, we have to understand how to estimate u(n) from a run of the simulator. Define the "busy function" This function will differ from run to run, and the appropriate function for server busyness is given by Integrating w.r.t. t over [0, T(n)] gives the desired estimator The numerator is simply the total time during the simulation that the server is busy.
B(t), arrival times and departure times for a realization of a single-server queueing system. (Law & Kelton, Fig. 1.6) T(6) denotes the time of completion of the sixth delay (begin service for sixth customer). 3 2 B(t) 1 0 1 2 3 4 5 6 7 8 9 e7= 3.8 e11= 3.8 e1= 0.4 e2= 1.6 e3= 2.1 e8= 4.0 e10= 5.6 e12= 7.2 e6= 3.3 e4= 2.4 e5= 3.1 e9= 4.9 e13= 8.6 = T(6)
The computation is quite simple, aided by the fact that B(t) takes only the values 0 and 1. If we were running a very busy bakery, we may want to know some more detailed information. For example, the probability (i.e., the expected proportion of time) that the number of customers in the queue (in the shop) will exceed the number allowed by the fire code. If the probability is large, we may have to do something; if it is small, we could probably ignore the problem.
Before examining the simulation and the “code” associated with it, we can take a quick look at a "geometric representation" of the system and its data structures. Each box on the right will contain a value, and every event will update some of the values. Event List Initialization time = 0 Server Status Clock 0.4 0 0 A D Times of Arrival ∞ Number in Queue Statistical Counters 0 0 0 Time of Last Event Number Delayed Area under Q(t) 0 0 0 Total Delay Area under B(t)
e7= 3.8 e11= 3.8 e1= 0.4 e2= 1.6 e3= 2.1 e8= 4.0 e10= 5.6 e12= 7.2 e6= 3.3 e4= 2.4 e5= 3.1 e9= 4.9 e13= 8.6 = T(6) Event List Arrival time = 0.4 Server Status Clock 1.6 1 0.4 A D Times of Arrival 2.4 Number in Queue 0.4 Statistical Counters 0 1 0 Time of Last Event Number Delayed Area under Q(t) 0.4 0 0 Total Delay Area under B(t)
e7= 3.8 e11= 3.8 e1= 0.4 e2= 1.6 e3= 2.1 e8= 4.0 e10= 5.6 e12= 7.2 e6= 3.3 e4= 2.4 e5= 3.1 e9= 4.9 e13= 8.6 = T(6) Event List Arrival time = 1.6 Server Status Clock 2.1 1 1.6 A D Times of Arrival 2.4 Number in Queue 0.4 1.6 Statistical Counters 1 1 0 1.6 Time of Last Event Number Delayed Area under Q(t) 1.6 0 1.2 Total Delay Area under B(t)
e7= 3.8 e11= 3.8 e1= 0.4 e2= 1.6 e3= 2.1 e8= 4.0 e10= 5.6 e12= 7.2 e6= 3.3 e4= 2.4 e5= 3.1 e9= 4.9 e13= 8.6 = T(6) Event List Arrival time = 2.1 Server Status Clock 3.8 1 2.1 A D Times of Arrival 2.4 Number in Queue 0.4 1.6 Statistical Counters 2.1 2 1 0.5 1.6 Time of Last Event Number Delayed Area under Q(t) 2.1 0 1.7 2.1 Total Delay Area under B(t)
e7= 3.8 e11= 3.8 e1= 0.4 e2= 1.6 e3= 2.1 e8= 4.0 e10= 5.6 e12= 7.2 e6= 3.3 e4= 2.4 e5= 3.1 e9= 4.9 e13= 8.6 = T(6) Event List Departure time = 2.4 Server Status Clock 3.8 1 2.4 A D Times of Arrival 3.1 Number in Queue 1.6 2.1 Statistical Counters 1 2 1.1 2.1 Time of Last Event Number Delayed Area under Q(t) 2.4 0.8 2.0 Total Delay Area under B(t)
e7= 3.8 e11= 3.8 e1= 0.4 e2= 1.6 e3= 2.1 e8= 4.0 e10= 5.6 e12= 7.2 e6= 3.3 e4= 2.4 e5= 3.1 e9= 4.9 e13= 8.6 = T(6) Event List Departure time = 3.1 Server Status Clock 3.8 1 3.1 A D Times of Arrival 3.3 Number in Queue 2.1 Statistical Counters 0 3 1.8 Time of Last Event Number Delayed Area under Q(t) 3.1 1.8 2.7 Total Delay Area under B(t)
e7= 3.8 e11= 3.8 e1= 0.4 e2= 1.6 e3= 2.1 e8= 4.0 e10= 5.6 e12= 7.2 e6= 3.3 e4= 2.4 e5= 3.1 e9= 4.9 e13= 8.6 = T(6) Event List Departure time = 3.3 Server Status Clock 3.8 0 3.3 A D Times of Arrival ∞ Number in Queue Statistical Counters 0 3 1.8 Time of Last Event Number Delayed Area under Q(t) 3.3 1.8 2.9 Total Delay Area under B(t)
Before we begin examining the simulation program, we must solve a problem: our customers will enter the queue according to some statistical distribution, and, since their requests will vary, the server will take times with each customer that will also depend on some statistical distribution. We could have observed a "real" system in operation, and we could have a file of data that we can use in the simulation - unfortunately, this is not what we want the simulation system for. In short, we need to generate arrival times and service times that satisfy the given distributions, so we can examine the results of many more runs than we could possibly get from reality. How do we do this?
Most computer languages provide a function that will generate random numbers in some range with the property that they will be uniformly distributed over the range. The quality of the built-in random number generators has varied in the past from "somewhat usable" to "worthless". The reason for it is that the people who design compilers and libraries are not always well-versed in ALL the aspects of the library they must implement… C has several random number generators and you should read their documentation BEFORE deciding which one - if any - to use. Let's assume that some kind of acceptable random number generator - uniform distribution - exists. How can we use it to generate random numbers according to some OTHER distribution?
In a number of applications, both the interarrival times and the service times satisfy an exponential distribution, i.e., a probability distribution with probability density function: where b is the mean. The uniform distribution for a uniform variate with values in [0, 1] is given by the probability density function: How do we go from one to the other? We know that the cumulative probability distribution is given by the integral of the probability density function.
If we run the random number generator and get X, the way to obtain an exponentially distributed variate follows from: For the two probabilities to be the same, we need to choose Y so that: solving for Y gives: We can use the observation that, if X is a uniformly distributed random variable with values in [0, 1], so is 1 - X, to reach the conclusion that Y = -bln(X) is an exponentially distributed random variable with mean b.
Pictorially: obtain 0 ≤ Y ≤ 1 from a uniformly distributed random number generator; draw the horizontal at height Y until you intersect the curve; draw the vertical to the horizontal axis and you have an exponentially distributed random variate. Easy and straightforward. Will work for other distributions - not quite as trivially...
Q: What is an EVENT? (from the point of view of a program) • A: A Data Structure with a run-time determinable Type (the type of event) and a Time Stamp. What kinds of events will we be dealing with? a) Arrival of a customer into the system - type 1 b) Departure of a customer from the system - type 2 An event of type 2 tells us that the server has become idle and is ready for another customer. Each event is associated with one or more procedures to be run.
Arrival Schedule next Arrival event When else? No Server Busy? Yes Add 1 to number in queue. Set delay = 0; gather statistics. Yes Queue Full? Add 1 to num. of custs. delayed. Exit gracefully. Make server busy. No Store time of customer arrival. Schedule departure event for customer. Return
Departure No Queue Empty? Yes Make server idle. Subtract 1 from queue size. No departure events. Compute delay for customer entering service. Statistics. Add 1 to num. custs. delayed. Schedule departure event for this customer. Move customers up one place in queue. Return
Discussion of Simulator Code: run terminated when a specified number of customers have been seen by the server (number of customers delayed). Individual functions. Simulation runs. Input and output files. Analysis of output. Problem: a single run, even if fairly long (what IS long?) will, in general, be inadequate to provide reliable values for the estimators. One should expect to run the simulation several times, with different random sequences - this requires resetting the seed for the random numbers generator each run - and then apply various statistical tests to determine the "confidence" with which we can claim that the results obtained are close to the "real" ones.
Alternate stopping rule: simulation time rather than number of customers delayed. Report Generation becomes an event, with a specified time. The event generates a report and terminates the simulation. Individual functions. Simulation runs. Input and output files. Analysis of output.
Events. Why did we choose the events we chose? The choice is not unique. The choice is not always obvious. The wrong choice will make the model much harder to set up, run and analyze. The right choice is up to you - the law of "no free lunch"… There are a number of graph theoretic formalisms that have been used, leading to a number of rules for the elimination of unnecessary events, the coalescing of several events into fewer ones, etc.
Simulation of an Inventory System. If you have a company in the business of retail sales, how do you manage your inventory? The question is not trivial, because always having enough in stock to satisfy all customers can be very expensive, while having too little in stock and having to tell your customers to wait will have the effect of losing them to your competitors. What you need is to find a way to "optimize" your decision. You may optimize based on financial considerations alone, or you may attempt to quantify "intangibles" and throw them into your evaluation function. We will use an evaluation function based on the state of the inventory, associating different costs to different inventory configurations.
Time over which the simulation will run: n time units (months?). Interdemand times (times between customers): independent identically distributed exponential random variables with mean 0.1 time units. Demand sizes (D): IID random variables with probabilities: The company orders Z items at the beginning of each month - Z could be 0. The ordering cost is made up of two components: a setup cost (K = 32 - dollars, whatever), incurred only if an order is processed, and an incrementalcost (iZ), where i = 3 (dollars,..). The ordering cost for the month is 0 if Z = 0.
Delivery Lag (or Lead Time): a random variable uniformly distributed between 0.5 and 1 time unit (month). Reorder Policy: if s is the minimum acceptable inventory and S is the maximum, the number to be ordered is determined by This kind of policy is called stationary, and is denoted by the pair (s, S). We will need to chose these two values when deciding on a specific policy. Inventory Level: I(t) will denote the inventory level at time t. If there are actual items in inventory, this number will be positive, if there is a backlog - orders presented but no items to be sold - the number will be negative and equal to the backlog. We will use two functions, the positive and negative parts:
The two functions allows us to differentiate two distinct costs: the holding cost, for items kept in physical storage, and the shortage cost, which can reflect the loss of customers, extra record keeping, etc.. We will assume a holding cost h = 1, and a shortage cost p = 5. We will assume the fixed costs - independent of the level of inventory - are zero. This is not realistic, but it may be adequate if all we want to do is compare the effectiveness of inventory control policies, rather than minimize all costs related to inventory. Over n time units, the average holding cost and average backlog cost are given by respectively.
A possible realization of our inventory strategy is given by the picture below. We will look at a number of distinct policies (s, S). S I(0) I(t) s Arrived Reorder S - I Reorder S - I
What are the Events? This is the first question we should ask. 1) Arrival of an order to the company from the supplier. 2) Demand for the product from a customer. 3) End of the simulation after n time units. 4) Inventory evaluation (and possible ordering) at the beginning of a month. The ordering of events reflect the decision that we won't bother going through the inventory evaluation when we quit: it would only reflect ordering costs for the next month anyway.
What probability distributions must we synthesize? 1) Interdemand times. These are exponentially distributed with mean 0.1 - and we already know how to do this from U(0,1). 2) The demand-size random variate D. Divide the unit interval [0, 1] into subintervals C1 = [0, 1/6), C2 = [1/6, 1/2), C3 = [1/2, 5/6), C4 = [5/6, 1]. The probability that U fall into any one interval is exactly the length of the interval - since U is uniformly distributed. 3) The delivery lags are uniformly distributed over [0.5, 1]. We simply transform V(0.5, 1) = 0.5 + (1 - 0.5)*U(0, 1). We now look at the logic of the main routines.
Order-Arrival event Demand event Increment the inventory level by the amount previously ordered. Generate the size of this demand. Eliminate order-arrival event from consideration. Decrement the inventory level by this demand size. Return Schedule the next demand event. Order Arrival Routine. Return Demand Routine.
Inventory- evaluation event Flowchart for inventory evaluation routine I(t) < s? Determine amount to be ordered [S - I(t)]. Incur ordering cost and gather statistics. Schedule order-arrival event for this order. Schedule the next inventory-evaluation event. Return
Update time-average statistical accumulators Was I(t) during the previous interval negative, zero or positive? Negative Positive Update area under I-(t). Update area under I+(t). Zero Return
Discussion of Simulator Code: run terminated when a specified number of months have passed. Individual functions. Simulation runs. Input and output files. Analysis of output.
Monte Carlo simulation: We finish with the computation of the area of a circle - or an application of Monte Carlo simulation. What is the area of a circle of radius 1? If we don't know the formula, a way to compute it is the following: Throw a whole bunch of random points at the square - it has area 4. We would expect that, for every 4 points thrown at the square, 3.141596… will fall in the circle