Download

1 / 30
340 likes | 630 Vues
Cournot Oligopoly and Welfare. by Kevin Hinde. Aims. In this session we will explore the interdependence between firms using the Cournot oligopoly models.

E N D
Cournot Oligopoly and Welfare by Kevin Hinde
Aims • In this session we will explore the interdependence between firms using the Cournot oligopoly models. • We will see that interdependence in the market (i.e. actual competition even among a few firms) reduces the welfare losses of market power but does not eradicate them.
Learning Outcomes • By the end of this session you will be able to • construct a reaction curve diagram and see how this translates into the traditional monopoly diagram. • work through a numerical example comparing and contrasting Cournot oligopoly with other market structures. • More mathematical students will be able to consider the finer aspects of the model.
Welfare and (Tight) Oligopoly • To understand the welfare implications of oligopoly we need to examine interdependence between firms in the market. • Welfare depends upon the number of firms in the industry and the conduct they adopt.
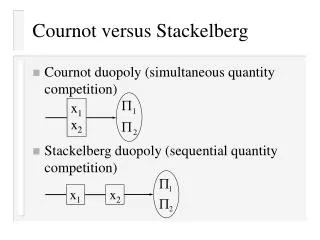
Augustin Cournot (1838) • Cournot’s model involves competition in quantities (sales volume, in modern language) and price is less explicit. • The biggest assumption made by Cournot was that a firm will embrace another's output decisions in selecting its profit maximising output but take that decision as fixed, i.e.. unalterable by the competitor.
If Firm 1 believes that Firm 2 will supply the entire industry output it will supply zero.
If Firm 1 believes that Firm 2 will supply the entire industry output it will supply zero.
If Firm 1 believes that Firm 2 will supply zero output it becomes a monopoly supplier.
If Firm 1 believes that Firm 2 will supply zero output it becomes a monopoly supplier.
If Firm 2 makes the same conjectures then we get the following:
A numerical example • Assume market demand to be P = 30 - Q where Q= Q1 + Q2 ie industry output constitutes firm 1 and firm 2’s output respectively • Further, assume Q1 = Q2 • and average (AC) and marginal cost (MC) AC = MC = 12
To find the profit maximising output of Firm 1 given Firm 2’s output we need to find Firm 1’s marginal revenue (MR) and set it equal to MC. So, • Firm 1’s Total Revenue is R1 = (30 - Q) Q1 R1 = [30 - (Q1 + Q2)] Q1 = 30Q1 - Q12- Q1Q2 • Firm 1’s MR is thus MR1 =30 - 2Q1 - Q2
If MC=12 then Q1 = 9 - 1 Q2 2 This is Firm 1’s Reaction Curve. • If we had begun by examining Firm 2’s profit maximising output we would find its reaction curve, i.e. Q2 = 9 - 1 Q1 2
We can solve these 2 equations and find equilibrium quantity and price. • Solving for Q1 we find Q1 = 9 - 1 (9 - 1 Q1) 2 2 Q1 = 6 • Similarly, Q2 = 6 and P = 18
Perfect Competition • Under perfect competition firms set prices equal to MC. So, P= 12 • and equilibrium quantity Q= 18 • Assuming both supply equal amounts, Firm 1 supplies 9 and so does Firm 2.
Monopoly • They would then maximise industry profits and share the spoils. TR =PQ =(30 - Q)Q = 30Q - Q2 MR =30 - 2Q • As MC equals 12 industry profits are maximised where 30 -2Q = 12 Q = 9 • So Q1 = Q2 = 4.5 • Equilibrium price • P= 21
Cournot Equilibrium compared using a traditional Monopoly diagram
Cournot Equilibrium compared using a traditional Monopoly diagram
Cournot Equilibrium compared using a traditional Monopoly diagram
A further point that must be considered is that if the number of firms increases then the Cournot equilibrium approaches the competitive equilibrium. • In our example the Cournot equilibrium output was 2/3s that of the perfectly competitive output. • It can be shown that if there were 3 firms acting under Cournot assumption then they would produce 3/4s of the perfectly competitive output level.
And Finally... • A summary • Have you covered the learning outcomes? • Any questions?