Download
1 / 59
590 likes | 804 Vues
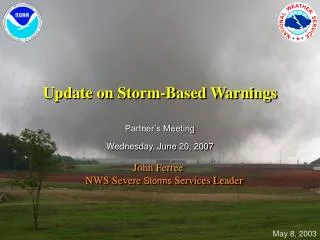
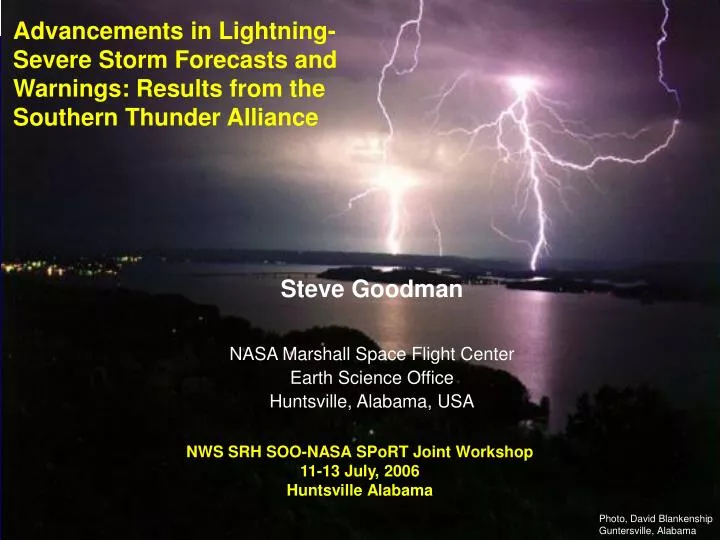
Advancements in Lightning-Severe Storm Forecasts and Warnings: Results from the Southern Thunder Alliance. Steve Goodman NASA Marshall Space Flight Center Earth Science Office Huntsville, Alabama, USA. NWS SRH SOO-NASA SPoRT Joint Workshop 11-13 July, 2006 Huntsville Alabama.

E N D
Advancements in Lightning-Severe Storm Forecasts and Warnings: Results from the Southern Thunder Alliance Steve Goodman NASA Marshall Space Flight Center Earth Science Office Huntsville, Alabama, USA NWS SRH SOO-NASA SPoRT Joint Workshop 11-13 July, 2006 Huntsville Alabama Photo, David Blankenship Guntersville, Alabama
Motivation and Background Science and Technology Infusion GOES-R Geostationary Lightning Mapper (GLM) VHF Lightning Mapping Nowcasting-Warning Decision Making WRF Forecasts of Thunderstorm Initiation and Lightning Threat Current Plans and the Way Forward Outline of Presentation
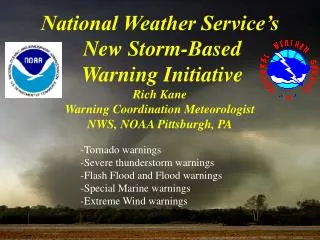
NASA and NOAA working together to save lives Tornado lead time -12 min national average Lightning strikes responsible for >500 injuries per year, 90% of victims suffer permanent disabilities and long term health problems, chiefly neurological in nature Lightning responsible for 80 deaths per year (second leading source after flooding) Aviation weather- airport operations, enroute savings $25M/yr In-cloud lightning lead time of impending ground strikes, often 10 min or more … forest fire initiation, utility crew deployment, NEXRAD coverage gaps, improved precipitation estimates, hail/wind/flood detection, … Background and Motivation
Continuous GEO Total Lightning will identify severe storm potential Process physics understood Ice flux drives lightning GLM GOES E View Storm-scale model for decision support system Physical basis for improved forecasts Updraft Intensifies IC flash rate controlled by graupel (ice mass) production (and vertical velocity) Demonstrated in LEO with OTD & LIS Vortex Spins-up Lightning jump precedes severe weather Lightning improves storm predictability
0 oC Flash Rate Coupled to Mass in the Mixed Phase Region Cecil et al., Mon. Wea. Rev. 2005 (from TRMM Observations)
TRMM LIS-Lightning: May 1999 Stroud, OK Tornado GOES-R GLM Perspective Mapping storm initiation, growth, decay • TRMM provides us a huge database of paired lightning, radar, IR and passive microwave observations (training / validation) • Over entire tropics & subtropics (generalization) • Total lightning increases as storm intensifies – can increase lead time for warning of severe and tornadic storms
GLM on GOES Dual imager concept GOES-R Geostationary Lightning Mapper (GLM) • July 2006 Status- • 3 on-going industry led GLM formulation studies • NESDIS sponsored risk reduction- NSSTC lead
NASA-NOAA-University-Industry Partners SPoRT Center (NASA MSFC/NSSTC) New Mexico Tech and other universities OU/NSSL Vaisala, Inc. WFOs – Huntsville (HUN), Nashville (OHX), Birmingham (BMX), Fort Worth (FDW), Melbourne (MLB), Norman (OUN), Sterling (LWX) NWS/MDL LMA systems located in NWS Southern Region North Alabama OU/NSSL New Mexico Tech Langmuir Laboratory White Sands Missile Range KSC/CCAFS (LDAR II) TAMU (LDAR II) Dallas/Fort Worth (Vaisala LDAR II) Southern Thunder AllianceA collaboration among LMA owner-operators and end users
Tennessee Alabama North Alabama LMA CoverageNWSFO HUN CWA
North Alabama Lightning Mapping Array (LMA) • Network of 10 detectors centered about HSV (NMT heritage) • Computes 4-D location of all electrical discharges (“flashes”) within LMA (CG…and IC, CC, CA) • Flash location overlaid on radar and satellite imagery and updated every minute • Trend information for individual storms • Validation for TRMM LIS • NASA Senior Review to extend mission approved through 2009
Ingest into AWIPS AWIPS Workstation Forecaster DS 1 NASA LDAD SRH FTP Server
VIL LMA 2-min NLDN 5-min Composite dBZ LMA Imagery in AWIPS • 17 height levels • Lowest level is composite • Auto-loads 2 min grids • Grids 1 km x 1 km, or 2 km x 2 km horizontal, 1 km vertical • Future Algorithm- use first VHF pulse to identify flash, ratio IC:CG grid for more rapid storm tendency insight • Can dither image with NEXRAD reflectivity and velocity, satellite, or any other fields SVR Upgraded to TOR
OPERATIONAL: 88D, LMA AND GOES B A dBZ HID A ZDR KDP B ARMOR: 04-07-05 Winds and HID ARMOR-88D WINDS RESEARCH: ARMOR HID OPERATIONAL: ARMOR HID Courtesy Walt Petersen
Total Lightning Impacts Decision Making…. • Has directly contributed to several correct severe warning decisions at HUN and BMX • “…the LMA density map gives you a great overall view of where storms with intensifying updrafts are located. So it gives you a good map of where to concentrate attention.” • “I believe the flash density rates were the primary factor in holding off on a warning.” • Used in Warning Event Simulator (WES) for office training
0.5 º SRM 1.5º SRM Ill-defined Rotational Couplet 0.5 º Refl LMA Source Density May 6, 2003 Case 1236 UTC
0.5 º SRM 1.5º SRM Broad Rotational Couplet 0.5 º Refl LMA Source Density Lightning Jump May 6, 2003 Case 1246 UTC
Lightning Hole Convective surge Lightning 'hole' and convective surge 'C' in tornadic storm, 0629 STEPS 2000 Lightning hole (WER)
LMA Benchmarking: Interim Results 2003-2005Warning Variable Rankings on Scale of 1-10
Southern Thunder Workshop #2Fort Worth, Texas 25-27, 2005 One of the Workshop Recommendations: Due to cancellation of VORTEX-II Experiment in 2007, pursue newly available opportunity to deploy, evaluate, and assess the scientific and technological merits of total lightning mapping with the NMT portable LMA in an additional operational setting. Why DC Metro Area: • Transitional climatic regime, yet still many severe storms • Coverage of 3 major heavily used airports • Complex terrain to west, urban environment • Sterling WFO history of supporting new technology assessments • Leverage with on-going TDWR evaluations • Proximity of MDL developers to WFO forecasters • Access to students, faculty for system operations/maintenance • Local interest (broadcast community, researchers, forecasters)
DC Lightning Mapping Array – Strawman Topology 68 km Circles: 150 km radius (approx. 3D coverage) 250 km radius (approx. max range)
25 km Strawman DC Metro Lightning Mapping Network (Oklahoma LMA as template) Mapping Stations Major Airports
DC Severe Thunderstorms 4 July 2006 “I used the DC-LMA web site to view updates on lightning activity during my shift at the command center (through about 3:45 PM). It was VERY useful, since I had no other "real-time" lightning data available. I used various links to NWS forecasts, radar, and satellite data via the Internet to conduct weather briefings to the command center staff. In addition, our WFO staff kept an eye on the DC area via all of the data available in AWIPS.… the DC-LMA data were VERY useful in monitoring storm activity. I was able to show the center staff where the lightning was occurring. In addition, I monitored changes in lightning coverage/intensity as a rough gauge of thunderstorm changes in intensity.” Steve Zubrick WFO Sterling (LWX)
DC Metro LMA Demo Network9 July 2006 at 2300 UTC 5-station LMA source density NEXRAD Reflectivity
Enhanced Thunder 19 July 2005 2000Z – 2012Z SPC Experimental Product NCEP SPC/Schaefer
SPC Experimental Product - Pr (CPTP) >= 1 x Pr (PCPN) >= .01” Uncalibrated probability of lightning F15 SREF 3-hr COMBINED PROBABILITY OF LIGHTNING
1 hr 2 hrs 3 hrs 4 hrs Warn on Forecast Concept Warn-on-forecast (warnings out to 4 hours based upon observations + short term model forecasts) Courtesy Kevin Kelleher, SDR Grand Challenges
WRF Thunderstorm Premises and Objectives Given: Precipitating ice aloft is correlated with LTG rates Mesoscale CRMs are being used to forecast convection CRMs can represent many ice hydrometeors (crudely) Goals: See if WRF can forecast LTG threat, based on ice flux in layers near -15 C. WRF: Weather Research and Forecast Model CRM: Cloud Resolving Model Additional Forecast Interests CI - convective initiation Ti - First lightning (35 dBZ at -15C, glaciation) Tp - Peak flash rate ~ VIL (Mass) Tf - Final lightning
WRF Thunderstorm and Lightning Forecasts:Methodology Use high-resolution (2-4 km) WRF simulations to prognose convection Develop diagnostics from model output fields to serve as a proxy for LTG Create 0-6 h forecasts of LTG threat based on WRF data Compare WRF forecasts with actual reflectivity and LTG and other observations using HSV area assets Subjectively and objectively evaluate WRF capabilities for forecasting LTG
4km horizontal resolution 37 vertical levels Dynamics and physics Eulerian mass core Dudhia SW radiation RRTM LW radiation YSU PBL scheme Noah LSM WSM 6-class microphysics scheme Explicit convection 24h forecast initialized at 00 UTC 10 December 2004 with AWIP212 NCEP EDAS analysis Eta 3-h forecasts used for LBC’s WRF Configuration10 December 2004 Case Study Cloud cover 18h forecast valid at 18 UTC 10 Dec 2004
WRF vs Eta Surface-based CAPE 18h fcst valid 18 UTC Dec 10
MIPS Sounding ~ 761 J/kg CAPE • Low level lapse rates and low freezing level efficient for converting CAPE to kinetic energy • Surface: T=15C, Td=10C • Similar CAPE to MIPS, but • for different reasons • High-res RAMS storm: • Max w = 19 m/s UAH MIPS, Kevin Knupp
WRF vs Eta 3h Regional Precip. 21h fcst valid 21 UTC 10 Dec 2004
WRF vs Eta 3h Local Precip. 21h fcst valid 21 UTC 10 Dec 2004 Question: Any lightning, when was it, What was WRF reflectivity at -15 C?
x2 x1 WRF Reflectivity (dBZ)at -15 C (4.0 km) 1200 UTC forecast valid at 18:50 UTC 10 Dec 2004
x1: Reflectivity (dBZ), Temperature (°C), and Pressure (hPa) 1200 UTC forecast valid at 18:50 UTC 10 Dec 2004 Max dBZ< 40 dBZ
x2: Reflectivity (dBZ), Temperature (°C), and Pressure (hPa) 6h 50m forecast valid at 18:50 UTC 10 Dec 2004 Max dBZ~50 dBZ; wmax only 4 m/s; But no hail reaches the surface
Ground-truth Report of Dime-Size Hail Owens Crossroads, AL, 10 Dec 2004
Rain/Hail -0.5 to 2 dB ARMOR: 12/10/04 17:55:06 EL=1.3o Rain/Hail 40-55 dBZ dBZ ZDR Hail -1.5 to 0.5 dB Hail 50-55 dBZ Rain 2 to 3.5 dB Rain 55+ dBZ -1.8 -0.9 0.1 1.0 1.9 2.9 3.6 -15 - 5 5 15 25 35 45 Hail 55+ dBZ Hail -1 to 0.5 dB LMA S. Cell 17:52:30 – 17:57:30 At 17:55 IC fl. rate ~ 3/minute in southern cell No IC’s in northern cell at 17:55 No CG’s in either cell for 20 minutes centered on 17:55 Only 3 CG’s detected for duration of storms
High-res RAMS “Validation” Run Reflectivity • 500 m horizontal resolution • Height, Dz is variable, from 250 m at bottom to 750 m at 20 km height • Domain 75 km x 75 km x 24.5 km • Time, Dt = 4 s, five acoustic steps between • Smagorinsky subgrid mixing scheme • 5-class precipitating hydrometeors: • Rain, snow, aggregates, graupel, hail • Initialized with 3K warm bubble, radius=12 km at z=0 • 120 min simulation, initiation effects dominate until t=60 min Note: wmax reaches 19 m/s
RAMS Graupel Cross-Section Graupel • 500 m horizontal resolution • Height, Dz is variable, from 250 m at bottom to 750 m at 20 km height • Domain 75 km x 75 km x 24.5 km • Time, Dt = 4 s, five acoustic steps between • Smagorinsky subgrid mixing scheme • 5-class precipitating hydrometeors: • Rain, snow, aggregates, graupel, hail • Initialized with 3K warm bubble, radius=12 km at z=0 • 120 min simulation, initiation effects dominate until t=60 min
RAMS Hail Cross-Section Hail • 500 m horizontal resolution • Height, Dz is variable, from 250 m at bottom to 750 m at 20 km height • Domain 75 km x 75 km x 24.5 km • Time, Dt = 4 s, five acoustic steps between • Smagorinsky subgrid mixing scheme • 5-class precipitating hydrometeors: • Rain, snow, aggregates, graupel, hail • Initialized with 3K warm bubble, radius=12 km at z=0 • 120 min simulation, initiation effects dominate until t=60 min Note: some hail reaches surface