Download
1 / 3
30 likes | 103 Vues
Online Tableau Training in USA also Hyderabad from RStrainigs allot classes on Tableu classroom & online in India with live project from 10 years real time experience faculty over UK, Singapore, Saudi, Canada, Aus. Best Tableau Training

E N D
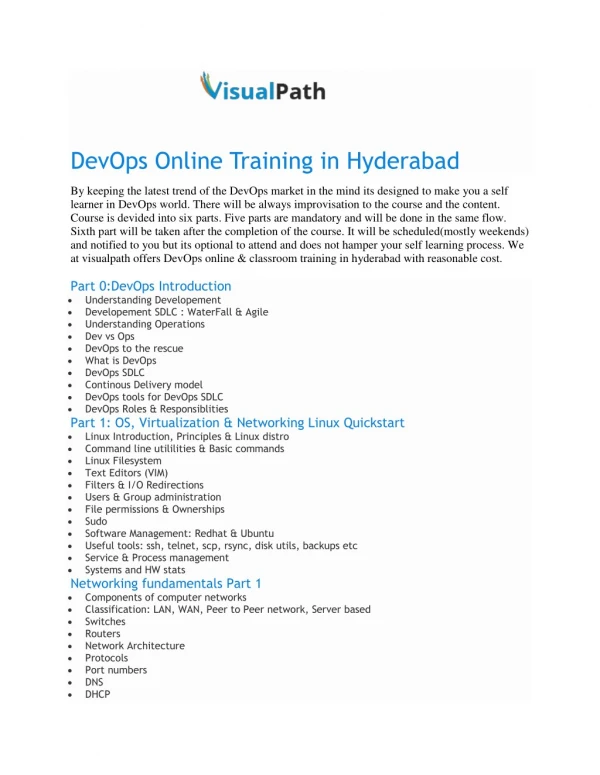
Call Us:-9052699906 www.rstrainings.com contact@rstrainings.com TABLEAU COURSE CONTENT: TABLEAU COURSE DESCRIPTION This course is designed for the beginner to intermediate-level Tableau user. It is for anyone who works with data – regardless of technical or analytical background. This course is designed to help you understand the important concepts and techniques used in Tableau to move from simple to complex visualizations and learn how to combine them in interactive dashboards. COURSE OBJECTIVE SUMMARY Understand the many options for connecting to data Understand the Tableau interface / paradigm – components, shelves, data elements, and Terminology. The student will be able to use this knowledge to effectively create the most Powerful visualizations. Create basic calculations including string manipulation, basic arithmetic calculations, custom Aggregations and ratios, date math, logic statements and quick table calculations Able to represent your data using the following visualization types: Cross Tab Geographic Map Page Trails Heat Map Density Chart Scatter Plots Pie Chart and Bar Charts Small Multiples Dual Axis and Combo Charts with different mark types Options for drill down and drill across Use Trend Lines, Reference Lines and statistical techniques to describe your data Understanding how to use group, bin, hierarchy, sort, set and filter options effectively
Work with the many formatting options to fine tune the presentation of your visualizations Understand how and when to Use Measure Name and Measure Value Understand how to deal with data changes in your data source such as field addition, deletion or Name change Understand all of your options for sharing your visualizations with others Combine your visualizations into Interactive Dashboards and publish them to the web COURSE CONTENT: 1. Introduction and Overview Why Tableau? Why Visualization? Level Setting – Terminology Getting Started – creating some powerful visualizations quickly The Tableau Product Line Things you should know about Tableau 2. Getting Started Connecting to Data and introduction to data source concept Working with data files versus database server Understanding the Tableau workspace Dimensions and Measures Using Show Me! Tour of Shelves (How shelves and marks work) Building Basic Views Help Menu and Samples Saving and sharing your work 3. Analysis Creating Views Marks Size and Transparency Highlighting Working with Dates Date aggregations and date parts Discrete versus Continuous Dual Axis / Multiple Measures Combo Charts with different mark types Geographic Map Page Trails Heat Map Density Chart Scatter Plots Pie Charts and Bar Charts Small Multiples Working with aggregate versus disaggregate data Analyzing
Sorting & Grouping Aliases Filtering and Quick Filters Cross-Tabs (Pivot Tables) Totals and Subtotals Drilling and Drill Through Aggregation and Disaggregation Percent of Total Working with Statistics and Trend lines 4. Getting Started with Calculated Fields Working with String Functions Basic Arithmetic Calculations Date Math Working with Totals Custom Aggregations Logic Statements 5. Formatting Options in Formatting your Visualization Working with Labels and Annotations Effective Use of Titles and Captions Introduction to Visual Best Practices 6. Building Interactive Dashboard Combining multiple visualizations into a dashboard Making your worksheet interactive by using actions and filters An Introduction to Best Practices in Visualization Sharing Workbooks Publish to Reader Packaged Workbooks Publish to Office Publish to PDF Publish to Tableau Server and Sharing over the Web Putting it all together Scenario-based Review Exercises Best Practices