Download

1 / 17
170 likes | 312 Vues
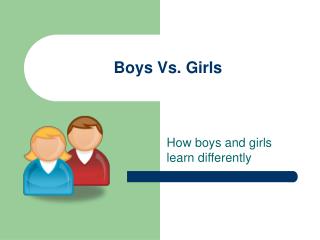
Do boys or girls have a larger growth spurt between the grades of two and six?. By Nerlande Monfort CMATH 6114 Comparative Study. The Plan. Ask a Question: Do boys or girls have a larger growth spurt between the grades of two and six? Observational Unit: The boys and girls

E N D
Do boys or girls have a larger growth spurt between the grades of two and six? By NerlandeMonfort CMATH 6114 Comparative Study
The Plan • Ask a Question: Do boys or girls have a larger growth spurt between the grades of two and six? • Observational Unit: The boys and girls • Variable: Heights at grades 2 and 6
Collect Appropriate Data: Since school is closed. I will be collecting data from students at our local Elementary and Middle School. The information is housed in the nurse’s office and is accessible through her. I will take the student information which is in alphabetical order and choose every third student until I gather heights for 20 girls and 20 boys. There are a total of 100 sixth graders in the school to choose from.
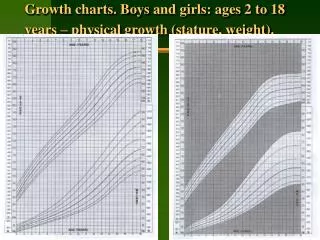
Analyze the Data: My data will be organized by grade and by gender. I will use a double line plot for boys and a separate double line plot for girls. I will find the mean of each plot to determine who had the larger growth spurt over those two grades.
Interpret the Results: My expectations are to find that at this level girls will have the larger growth spurt. I am basing this simply on past observations. Boys seem to have their growth spurt in Middle school. Possible biases may include convenience sampling since my data is only being taken from one school. I may also have a measurement bias since these student’s heights were taken by hand and then copied onto a medical card. This information was then put into the computer.
ABSTRACT In the study, the design applied to get the data will be simple random sampling without replacement. The data will be analyzed and conclusions made by comparison of the students total heights in their genders at the two different grades.
Background The previous research on this topic have reported the general growth but failed to count on the ages between these two grades. The applications of the previous research reports have shown reliance and believe in the general growth pattern of growth in young school going children though they have not specified on these two ages to explain whether it’s a just a believe that girls grow faster between these grades or its true from practical research findings.
Design of the research and data collection techniques To ensure the collection of high-quality data, the data will be obtained from the identified population to get reliable and make conclusions. There will be a proper way of designing the sampling strategy used to ensure that potential boys and girls are picked who will be drawn from a representative sample of the intended population.
Design of the research and data collection techniques cont… The samples will be obtained in a scientifically rigorous manner to ensure the findings will be generalizable to the intended population. The analysis of the data will not be homogenously because the selected survey compares two different grades and in different genders significantly.
Design of the research and data collection techniques cont… Growth at each grade will be analyzed as an independent sample. In terms of execution of the study, since the population is already identified, the implementation of the study will begin by designing the samples. Data collection tools will be designed, and completeness of data collected will be ensured by getting the data and start of analysis.
Design of the research and data collection techniques cont… Strata sample will be based on the formula ni = Nin/N where n1 is the stratum sample,N1 is the student population in each grade of study (stratum size),n is total sample (n=n1+n2) and N is the total student population. The assumption is that the number of girls and boys in each grade is the same and that they are arranged alphabetically in their medical register without considering any other factor. It is also assumed that in grade two the total number of students is also 100.
Data Collected PART 1
Conclusion From the means and the double plot it can be seen that the boys consistently have the larger growth spurt than girls in both of the grades. This beats the expectations earlier formed. This may be attributable to biases. Possible biases may include convenience sampling since my data is only being taken from one school. I may also have a measurement bias since these student’s heights were taken by hand and then copied onto a medical card. Based on the outcome of the analysis the research question can be answered: Boys have a larger growth spurt between the grades of two and six