Download
1 / 19
190 likes | 277 Vues
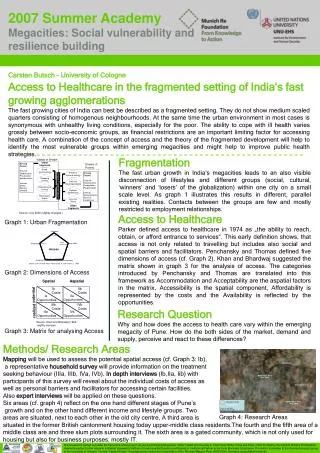
Assimilation of space and air borne measurements in a tropospheric chemistry transport model by 4D-var. H. Elbern, A. Strunk Rhenish Institute for Environmental Research at the University of Cologne. Contents. Introduction: why 4D-var Assimilation of flight campaign data

E N D
Assimilation of space and air borne measurements in a tropospheric chemistry transport model by 4D-var H. Elbern, A. Strunk Rhenish Institute for Environmental Research at the University of Cologne
Contents • Introduction: why 4D-var • Assimilation of flight campaign data • Assimilation of satellite data cost04.ppt
Design of the case study • CTM and adjoint CTM (symmetric operator split): • RADM2 gas phase: 61 species • 4th order Bott advection, horiz. & vert. • Implicit diffusion (Thomas algorithm) • Grid: 125/54 km horiz. spacing, 100 hPa • large grid: 77 x 67 x 26 (refined tropopause: Dz ~1 km) • Meteorological fields by MM5 • Case studies: • CONTRACE: 14. November 2001 • SPURT: 17.-19. January 2002 cost04.ppt
Design of the assimilation experiment • assimilation interval 00:00-16:00 UTC( max), • optimisation: • SPURT:chemical state variables • CONTRACE: chemical state variables + emission rates • isotrop. background error covariance matrix (BECM) • L-BFGS (quasi-Newton) minimisation • Preconditioning by square root (BECM) cost04.ppt
4D-var configuration Mesoscale EURAD 4D-var data assimilation system meteorological driver MM5 emission rates direct CTM fore- cast Initial values minimisation adjoint CTM EURAD emission model EEM emission 1. guess gradient observations analysis cost04.ppt
SPURT: Trace gas Transport in the Tropopause RegionCoord.: A. Engel, Univ Frankfurt • Original project objectives: to analyse transport signatures in terms of chemical ages in the mixing region of troposphere and stratosphere • However: • not suitable for a limited area data assimilation set-up. Hence, find chemical states, correlation length. • Find chem state at 00:00 UTC to best match daytime observations p.m. 19. a.m. 19. a.m. 17. p.m. 18. assimilation interval 17.-19. Jan. 2002 p.m. 17. 00 10 UTC 12 a.m. 18. cost04.ppt
SPURT Jan 17, 2002 O3 1. guess assimilation result observations flight height [km] CO cost04.ppt
SPURT Jan 18, 2002 am: Canary Isl. Casablanca pm: Casablanca Hamburg O3 CO 1. guess assimilation result observations flight height [km] cost04.ppt
SPURT Jan 19, 2002 am: Hamburg North Cape pm: North Cape Hamburg O3 CO 1. guess assimilation result observations flight height [km] cost04.ppt
CONTRACEConvective Transport of Trace Gases into the upper Troposphere over Europe: Budget and Impact of ChemistryCoord.: H. Huntrieser, DLRflight path Nov. 14, 2001 cost04.ppt
CONTRACENov. 14, 2001, southbound NO O3 H2O2 HCHO 1. guess assimilation result observations flight height [km] CO cost04.ppt
CONTRACENov. 14, 2001 north (= home) bound NO O3 CO H2O2 1. guess assimilation result observations flight height [km] cost04.ppt
Assimilated data types • in situ • surface observations • radio sondes • aircraft • tethered balloons • Satellites: GOME • tropospheric NO2 columns • tropospheric NN derived ozone profiles (Dh=1km) cost04.ppt
forecast without assimilation # molec./cm2 post assimilation forecast started: 3.8.97 06:00 UTC # molec./cm2 Assimilation of GOME NO2 tropospheric columns, 3.8.1997 # molec./cm2 GOME NO2 columns: Courtesy of A. Richter, IFE, U. Bremen GOME NO2 columns: Courtesy of A. Richter, IFE, U. Bremen NOAA ch 3 (near infrared) cost04.ppt
GOME ozone profile assimilation (3.8.1993)Data: Neuronal Network retrieval (Müller et al., 2003) +NN ozone retrieval cost04.ppt
GOME ozone profile assimilation II (3.8.1993)Data: Neuronal Network retrieval (Müller et al., 2003) +NN ozone retrieval cost04.ppt
Assimilation of GOME NO2 tropospheric columns, 5.8.1997 forecast without assimilation # molec NO2/cm2 # molec NO2/cm2 GOME NO2 columns: Courtesy of A. Richter, IFE, U. Bremen post assimilation forecast started: 3.8.97 06:00 UTC # molec NO2/cm2 NOAA ch 3 (near infrared) cost04.ppt
Conclusions: • successful UTLS data assimilation in a mixing regime requires readiness to identify different chemical regimes locally: • strat. intrusions, free troposphere, updrafts • problem of first guess with phase shifts (e.g. streamers must be captured correctly) • smoother algorithms give qualitative indication on the ability to simulate observations cost04.ppt
Acknowledgments • Data provision • CONTRACE: Dr. H. Huntrieser and project, • SPURT: Dr. C. Schiller and group, ICG-I, FZ Jülich; Dr. H. Fischer and group, MPI-C, Mainz • Funding by BMBF • ZAM, FZ Jülich for computational facilities cost04.ppt