Download
1 / 25
250 likes | 336 Vues
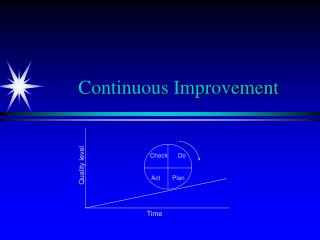
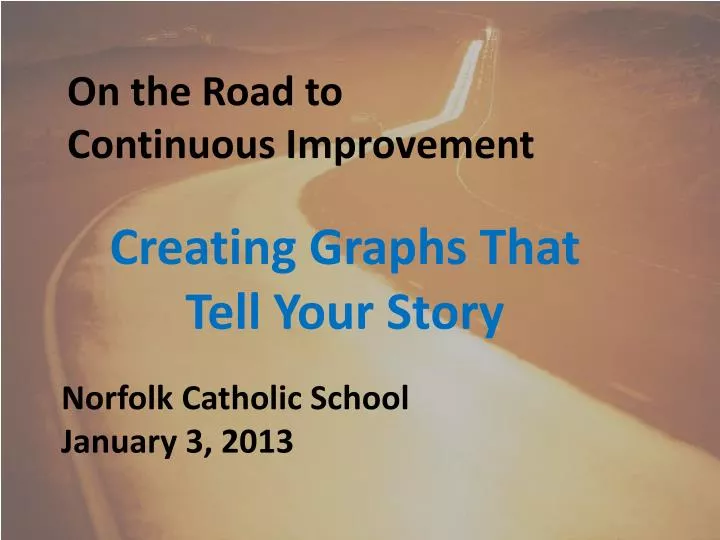
On the Road to Continuous Improvement. Creating Graphs That Tell Your Story. Norfolk Catholic School January 3, 2013. Today’s Agenda. Connecting today’s work to the Here’s What, So What, Now What from our work in November Using 4 th Grade Writing Data as a model for graphing

E N D
On the Road toContinuous Improvement Creating Graphs That Tell Your Story Norfolk Catholic School January 3, 2013
Today’s Agenda • Connecting today’s work to the Here’s What, So What, Now What from our work in November • Using 4th Grade Writing Data as a model for graphing • Attributes of Graphing
Demographic Data Achievement Data Four Lenses of Data Data Driven Decisions Perception Data Program Data
Demographic Data: • Free/reduced lunch status • Gender • Student ethnicity • Mobility rate • Discipline referrals, suspensions, and expulsions • Daily rate of attendance Four Lenses of Data
Achievement Data • Archdiocesan Assmts, NeSA, • Standardized Tests: Terra Nova, ACT, MAP,etc. • Local Common Assessments (NNNC Writing) • Classroom Student Grades • Alternative Assessment Data • Portfolios Four Lenses of Data
Creating the Profile http://www.education.ne.gov/CIPToolkit/creating.html
CHARACTERISTICS OF DATA DISPLAYS • Simple • Neat in appearance • One graphic per page is ideal-- use no more than two • Easily understood by all stakeholders • Have all components necessary to assure comprehension
CHARACTERISTICS OF DATA DISPLAYS (cont.) • Complete enough to stand alone • Writing is clear, concise, correct, and complete • Statements of fact only • No judgmental statements
READING SCORES Our scores improved in all categories
McInteer Elementary 5th Grade Terra NovaReading Comprehension Subtest 2002n=128/12 2003n=150/17 2004n=149/21 2005n=166/26 2006n=174/33 YEARS Chart 1 illustrates the growth on the Reading Comprehension subtest of the Terra Nova over a 5-year period. Baseline year for this assessment was 2002. The test was given to all 5th grade students the first week of each April. The chart also compares the scores of all students to those classified as Limited English Proficient (LEP). Both populations made gains from year 1 to year 5, however there is still a discrepancy between the two populations. A slight decline occurred in year two in both populations. Year two was the last year of the Bluster Day reading series. “All”contains LEP.
Fourth Grade Reading Scores STARS STARS standard 4.1.3 was used to measure reading comprehension. During the course of four years, the number of students meeting proficiency increased.
Consider these Questions • What can we learn from the data? • What are our strengths and challenges? • Do we have other data to support these results? • What are the implications of the data? • What will we do as a result of the implications?
Creating the Profile http://www.education.ne.gov/CIPToolkit/creating.html
Step 7: Reflect On and Analyze Data • Review the data presented • Allow for ample time of review
Step 6: Organize and Present Data • How should the data be displayed? • Can the displays be easily generated? • Does the district have all the displays of the data that it needs? • Does it have some that should be eliminated? • Where is it stored?