Download
1 / 26
260 likes | 435 Vues
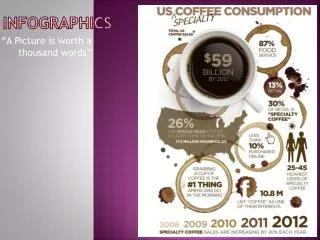
Infographics. Design. getting started. An infographic pairs solid reporting with attractive, purposeful design. Done well, an infographic can convey important information in a simple form or break down complex material for readers.

E N D
Infographics Design
getting started An infographic pairs solid reporting with attractive, purposeful design. Done well, an infographic can convey important information in a simple form or break down complex material for readers. Today we’ll look at infographic types in the context of design. Refer to other curriculum modules like News Gathering to learn about how to collect reliable data.
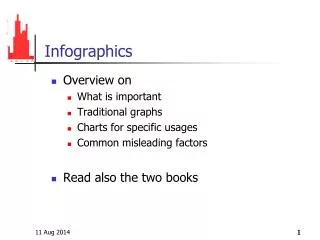
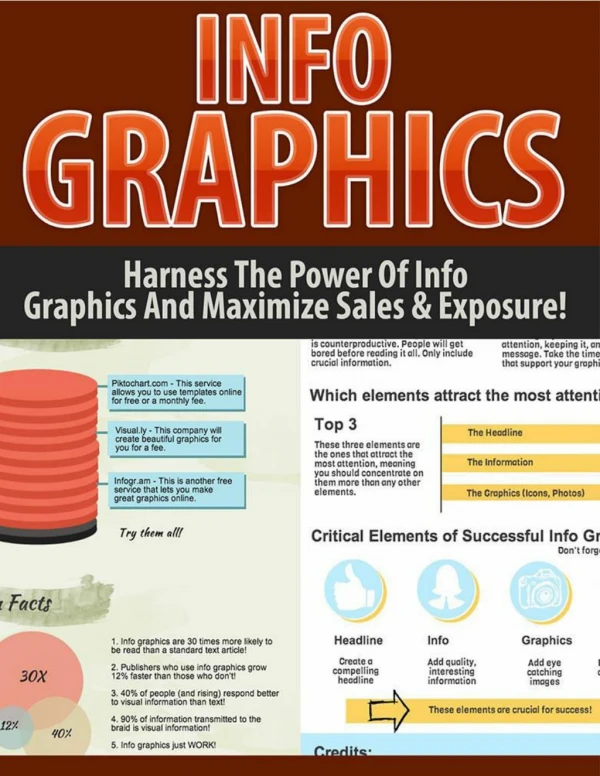
benefits • infographics break information into smaller parts, making it easier to understand and more likely to be remembered • they create additional entry points, breaking up text-heavy pages
by definition An infographic combines text and illustrations to convey information visually. An infographic generally has four parts: • headline (a title to indicate topic/subject) • data (the “info” part: numbers, statistics, terms or key content to deliver) • visual (icon, photo, illustration or art element: the “graphic” aspect) • source (credible origin of information)
pie chart Whitney High Student Media, Rocklin, Calif.
public opinion poll Whitney High Student Media, Rocklin, Calif.
timeline presents key events in the order they occurred The Echo; St. Louis Park (Minn.) High School
fast fact box delivers information in bite-size “chunks” based on facts or statistics Whitney High Student Media, Rocklin, Calif.
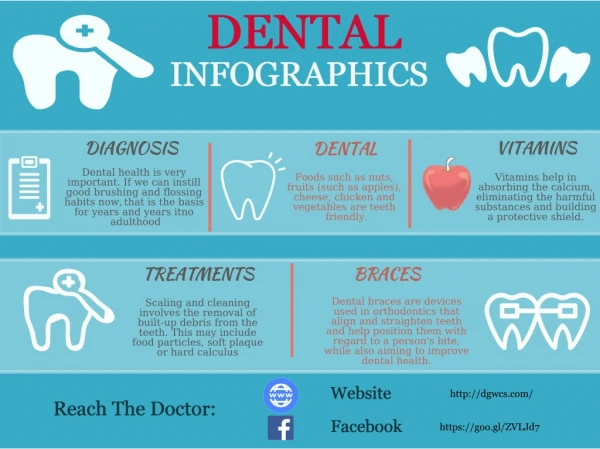
diagram labels parts of a whole or breaks down something complex into smaller pieces Whitney High Student Media, Rocklin, Calif.
map The Echo; St. Louis Park (Minn.) High School
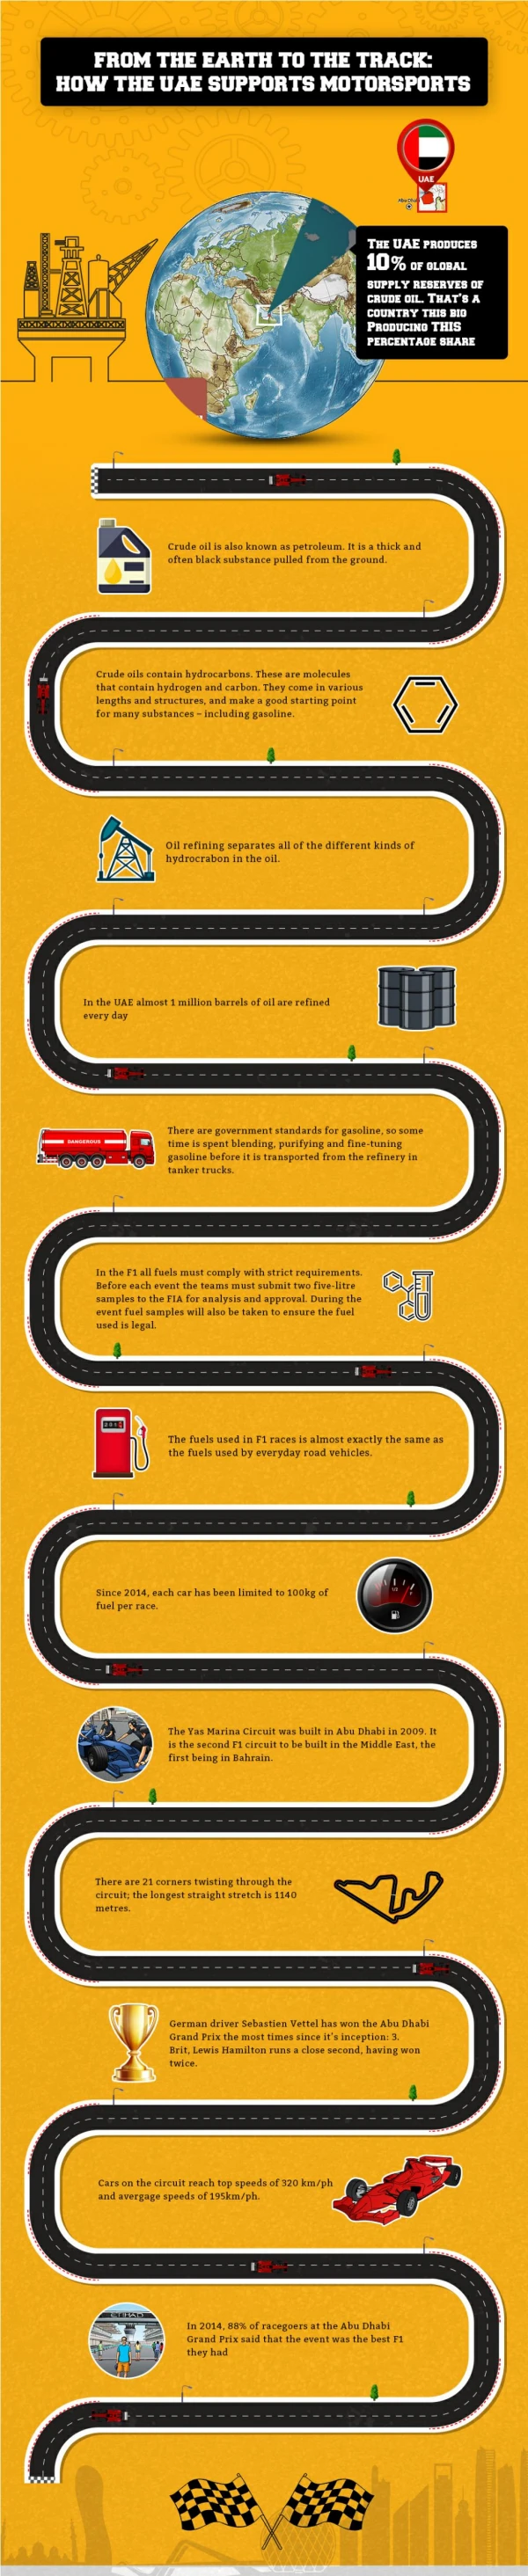
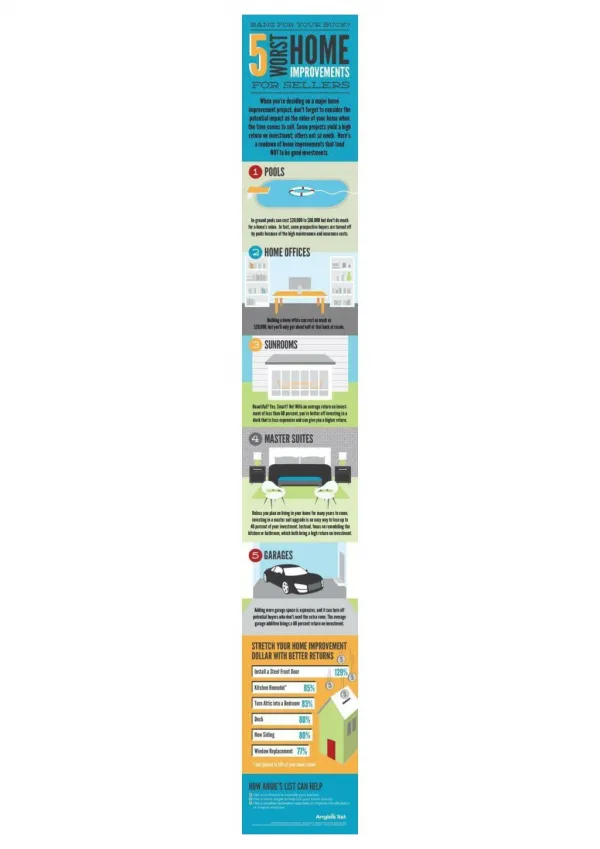
two main types Infographics generally fall into these two types: • supplemental • an infographic that accompanies a traditional story; usually placed beside it on a page to provide additional information or to break down complex ideas from the copy block • standalone • an infographic presented by itself as the story; readers should be able to take away complete information (infographic provides full context)
supplemental this infographic accompanies the main story (see previous slide)
standalone Whitney High Student Media, Rocklin, Calif.
design decisions coordinate color follow visual hierarchy focus on readability Whitney High Student Media, Rocklin, Calif.
keep type simple, consistent Whitney High Student Media, Rocklin, Calif.
small text in color is difficult to read pay attention to alignment, case, hyphenation and other type considerations as with all design decisions, remember: “form follows function” readability Whitney High Student Media, Rocklin, Calif.
graphic element such as lines (diagonal lines, outline date box, type outline in headline repeating color use design unity Whitney High Student Media, Rocklin, Calif.
repeating shapes from rounded graphic to circle photos use of tints to create visual variety on black-and-white page design unity The Echo; St. Louis Park (Minn.) High School
tight space (packaging proximity) The Echo; St. Louis Park (Minn.) High School
combination this supplemental infographic combines ratings with a step-by-step guide The Echo; St. Louis Park (Minn.) High School
content-inspired let the topic take you outside the box The Echo; St. Louis Park (Minn.) High School
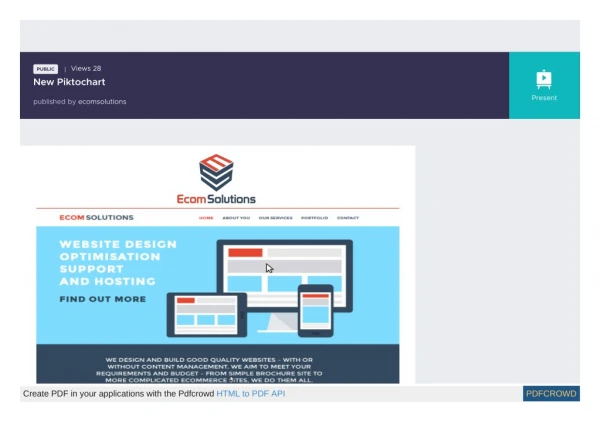
exploration Use your mobile devices or classroom computers to search online. • What sites have collections of infographics? • What sites help you create infographics online? • Which news websites incorporate infographics on their front page? • Any other interesting findings?
brainstorm • What topics would make for good infographics for readers at this school? • Two-minute brainstorm as you make a list. • Two-minute pair share with the person sitting next to you. Pick your best idea to share with the class. • Class discussion with list on the board. • Which one do you want to create?