Download
1 / 39
390 likes | 597 Vues
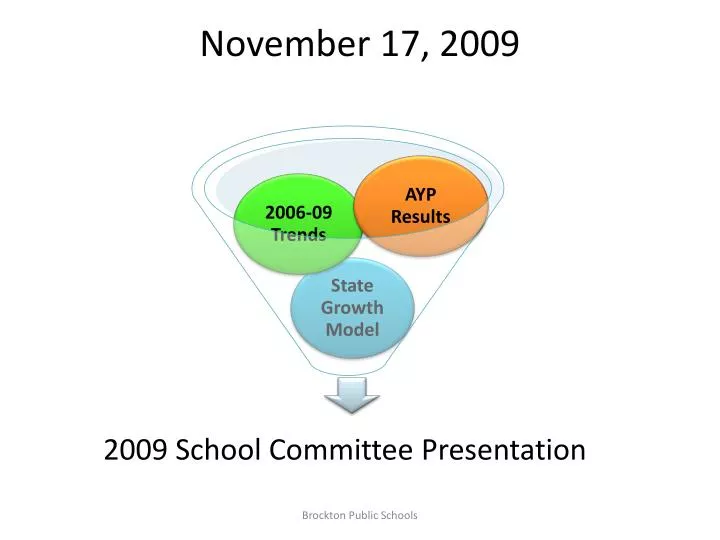
November 17, 2009. 2009 School Committee Presentation. 2009 School Committee Presentation. AYP Accomplishments. 18 Ways to Miss AYP. 3 Categories. 6 Targets. Brockton High School ELA. AYP Challenges. AYP Success in the Aggregate, Challenge with Subgroups. 2006-09 Trends.

E N D
November 17, 2009 2009 School Committee Presentation Brockton Public Schools
2009 School Committee Presentation Brockton Public Schools
AYPAccomplishments Brockton Public Schools
18 Ways to Miss AYP 3Categories 6 Targets Brockton High School ELA Brockton Public Schools
AYP Challenges Brockton Public Schools
AYP Success in the Aggregate, Challenge with Subgroups Brockton Public Schools
2006-09 Trends Brockton Public Schools
ELA CPI Aggregate BPSvs. State 8.8 9.3 Brockton Public Schools
Decreasing the Gap with the state 2006-09 ELA CPI Brockton Public Schools
Closing in on the state ELA CPI Brockton Public Schools
Grade 3 ELA 2006-09 BPS Vs State .8 Drop 8 Point Drop Brockton Public Schools
2009 Highest ELA CPI 8.8 Brockton Public Schools
Grade 3 ELA 14 Brockton Public Schools
Grade 10 CPI 3.1 Brockton Public Schools
Math CPI Aggregate BPS vs. State 11.4 11.6 Brockton Public Schools
Decreasing the Gap with the state 2006-09 MTH CPI Brockton Public Schools
Grade 3 CPI Math BPS State 8 point Drop 3.5 point gain Brockton Public Schools
Grade 6 Math CPI 8.1 Brockton Public Schools
Grade 3 14.6 Brockton Public Schools
2009 Highest District Math CPI 11.4 Brockton Public Schools
ELA Standouts Brockton Public Schools
Math Standouts Brockton Public Schools
2006-09 Trend Summary Brockton Public Schools
Subgroup Achievement Gap Brockton Public Schools
ELA CPI SPED BPSvs. State 10.3 12.4 Brockton Public Schools
BPS Hispanic Math CPI higher than State Hispanic Average! + 1.3 Brockton Public Schools
BPS Hispanic ELA CPI 2009 higher than State Hispanic Average +.9 Brockton Public Schools
LEP Math 2009 5.3 point gap Brockton Public Schools
2009 LEP ELA CPI 6 point gap Brockton Public Schools
Summing up Subgroups Brockton Public Schools
State Growth Model: Student Growth Percentile (SGP) Brockton Public Schools
Growth to grade 7: Three students • Academic Peer Group Grade 5 2007 Grade 6 2008 Grade 7 2009 SGP 2009 Gina 230 230 230 35 Harry 248 248 244 25 Ivy 214 214 226 92 Brockton Public Schools
35 Interpreting student growth percentiles Gina’s SGP was 35. This means her score in grade 7 was higher than 35 percent of her academic peers (and less than 65 percent). • Is that amount of growth typical? Lower growth Typical growth Higher growth Percent of students Brockton Public Schools
Seeking the Northeast Quadrant Growth SGP Performance (CPI) Brockton Public Schools
2006-09 SGP Trend Summary Brockton Public Schools
Grade 8 ELA SGP vs. CPI growth Performance Brockton Public Schools
Grade 10 ELA CPI Vs SGP Brockton Public Schools
Conclusions Brockton Public Schools
END 2009 School Committee Presentation Brockton Public Schools