Download
1 / 47
480 likes | 631 Vues
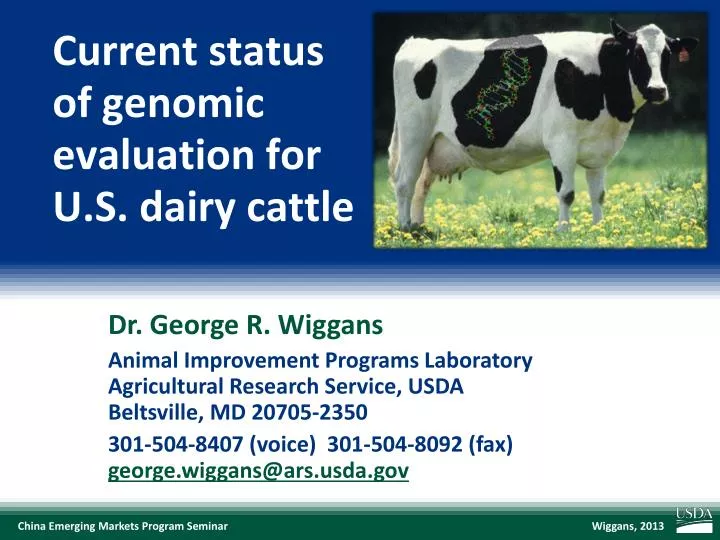
Current status of genomic evaluation for U.S. dairy cattle. Genotypes received (last 12 months). Genomic data flow. Dairy Herd Improvement (DHI) producer. DNA samples. DNA samples. genomic evaluations. DNA samples. DNA laboratory. AI organization, breed association. genotypes.

E N D
Genomic data flow Dairy Herd Improvement (DHI) producer DNA samples DNA samples genomic evaluations DNA samples DNA laboratory AI organization, breed association genotypes nominations, pedigree data genotypes genotype quality reports genomic evaluations Council on Dairy Cattle Breeding (CDCB)
Evaluation flow • Animal nominated for genomic evaluation by breed association or AI organization • Hair or other DNA source sent to genotyping lab
Evaluation flow (continued) • DNA extracted and placed on chip for 3-day genotyping process • Genotypes sent from genotyping lab to CDCB for accuracy review
Laboratory quality control • Each SNP evaluated for • Call rate • Portion heterozygous • Parent-progeny conflicts • Clustering investigated if SNP exceeds limits • Number of failing SNPs indicates genotype quality • Target of <10 SNPs in each category
Before clustering adjustment 86% call rate
After clustering adjustment 100% call rate
Evaluation flow (continued) • Genotype calls modified as necessary • Genotypes loaded into database • Nominators receive reports of parentage and other conflicts • Pedigree or animal assignments corrected • Genotypes extracted and imputed to 45K
Imputation • Based on splitting genotype into individual chromosomes (maternal and paternal contributions) • Missing SNPs assigned by tracking inheritance from ancestors and descendants • Imputed dams increase predictor population • Genotypes from all chips merged by imputing SNPs not present
findhap • Developed by Dr. Paul VanRaden, ARS, USDA • Divides chromosomes into segments • Allows for successively shorter segments (usually 3 runs) • Long segments lock in identical by descent • Shorter segments fill in missing SNPs • Separates genotype into maternal and paternal contribution, haplotypes (phasing) • Builds haplotype library sequenced by frequency
Evaluation flow (continued) • SNP effects estimated • Final evaluations calculated • Evaluations released to dairy industry • Download from CDCB FTP site with separate files for each nominator • Monthly release for new animals • All genomic evaluations updated 3 times each year with traditional evaluations
Information sources for evaluations • Traditional evaluations of genotyped bulls and cows used to estimate SNP effects • Combined final evaluation • Sum of SNP effects for an animal’s alleles • Polygenetic effect • Traditional evaluation • Pedigree data used and validated by genotypes
Genotypes evaluated 2009 2010
Holstein prediction accuracy *2013 deregressed value – 2009 genomic evaluation
Holstein prediction accuracy *2013 deregressed value – 2009 genomic evaluation
Parent ages for marketed Holstein bulls 100 90 Sire 80 Dam 70 60 Parent age (mo) 50 40 30 20 10 0 2007 2008 2009 2010 2011 2012 Birth year
Genetic merit of marketed Holstein bulls Average gain: $77.51/year Average gain: $43.76/year Average gain: $20.21/year
Genomic prediction of progeny test 0 1 2 3 4 5 • Select parents, transfer embryos to recipients Calves born from DNA-selected parents Bull receives progeny test • Calves born and DNA tested Reduce generation interval from 5 to 2 years
Benefit of genomics • Determine value of bull at birth • Increase accuracy of selection • Reduce generation interval • Increase selection intensity • Increase rate of genetic gain Bovine G-Nome
Why genomics works for dairy cattle • Extensive historical data available • Well-developed genetic evaluation program • Widespread use of AI sires • Progeny-test programs • High-value animals worth the cost of genotyping • Long generation interval that can be reduced substantially by genomics
Current organizational roles • Council on Dairy Cattle Breeding (CDCB) responsible for receiving data, computing, and delivering U.S. genetic evaluations for dairy cattle • Animal Improvement Programs Laboratory (AIPL) responsible for research and development to improve the evaluation system • CDCB and USDA employees co-located in Beltsville
Funding • CDCB evaluation calculation and dissemination funded by fee system • Based on animals genotyped • About 80% of revenue from bulls • Higher fees for herds that contribute less information • AIPL research on evaluation methodology funded by U.S. Federal government $
Ways to increase accuracy • Automatic addition of traditional evaluations of genotyped bulls when bull is 5 years old • Possible genotyping of 10,000 bulls with semen in repository • Collaboration with other countries • Use of more SNPs from HD chips • Full sequencing (identify causative mutations)
Evaluation accuracy by included SNPs Reliability (%)* Trait 45K 60K 75K 91K Milk 69.2 69.3 (0.1) 68.9 ( – 0.3) 69.2 (0.0) Fat 68.4 68.7 (0.3) 68.6 (0.2) 68.4 (0.0) Protein 60.9 60.8 ( – 0.1) 60.6 ( – 0.3) 60.8 ( – 0.1) Fat percentage 93.7 94.4 (0.7) 93.9 (0.2) 93.5 ( – 0.2) Protein percentage 86.3 87.1 (0.8) 86.3 (0.0) 86.1 ( – 0.2) Net merit 51.6 51.7 (0.1) 51.6 (0.0) 51.3 ( – 0.3) Productive life 73.7 74.0 (0.3) 73.1 ( – 0.6) 73.8 (0.1) Somatic cell score 64.9 65.8 (0.9) 65.6 (0.7) 65.6 (0.7) Daughter pregnancy rate 53.4 54.1 (0.7) 53.6 (0.2) 53.8 (0.4) Service - sire calving ease 45.8 45.7 ( – 0.1) 45.1 ( – 0.7) 46.2 (0.4) Daughter calving ease 44.2 45.8 (1.6) 44.9 (0.7) 44.9 (0.7) Service - sire stillbirth rate 28.2 28.3 (0.1) 28.7 (0.5) 29.9 (1.7) Daughter stillbirth rate 37.6 37.8 (0.2) 37.1 ( – 0.5) 39.2 (1.6) *Difference in reliability from 45K in parentheses
Evaluation accuracy (continued) Reliability (%)* Trait 45K 60K 75K 91K Final score 58.8 58.7 ( – 0.1) 58.4 ( – 0.4) 58.7 ( – 0.1) Stature 68.5 69.0 (0.5) 68.8 (0.3) 69.1 (0.6) Dairy form 71.8 72.2 (0.4) 71.9 (0.1) 72.0 (0.2) Rump angle 70.2 70.9 (0.7) 70.7 (0.5) 70.9 (0.7) Rump width 65.0 65.4 (0.4) 65.0 (0.0) 65.2 (0.2) Feet and legs 44.0 45.1 (1.1) 45.1 (1.1) 45.1 (1.1) Fore udder attachment 70.4 70.6 (0.2) 70.0 ( – 0.4) 70.4 (0.0) Rear udder height 59.4 59.9 (0.5) 59.6 (0.2) 59.8 (0.4) Udder depth 75.3 76.2 (0.9) 76.0 (0.7) 76.1 (0.8) Udder cleft 62.1 62.2 (0.1) 62.0 ( – 0.1) 62.2 (0.1) Front teat placement 69.9 70.1 (0.2) 70.2 (0.3) 70.4 (0.5) Teat length 66.7 67.2 (0.5) 66.6 ( – 0.1) 66.9 (0.2) All production, type, and fitness traits (0.5) (0.1) (0.4) *Difference in reliability from 45K in parentheses
Key issues for the dairy industry • Inbreeding and genetic diversity (including across breeds) • Sequencing, new genes, and mutations • Novel traits, resource populations (feed efficiency, health, milk properties)
Application to more traits • Animal’s genotype good for all traits • Traditional evaluations required for accurate estimates of SNP effects • Traditional evaluations not currently available for heat tolerance or feed efficiency • Research populations could provide data for traits that are expensive to measure • Will resulting evaluations work in target population?
What’s already planned • Genomic evaluations for new traits • Health (e.g., resistance to heat stress) • Feed efficiency • Genomic mating programs • Selection of favorable minor alleles • Reduction of genomic inbreeding • Genomic evaluations based on more SNPs (60K) • Adding SNPs for causative genetic variants
What’s already planned(continued) • BARD project (Volcani Center, Israel) • A priori granddaughter design (APGD) • Identification of causative variants for economically important traits • International collaboration on sequencing • United States, United Kingdom, Italy, Canada • Bulls selected using APGD
Parentage validation and discovery • Parent-progeny conflicts detected • Animal checked against all other genotypes • Reported to breeds and requesters • Correct sire usually detected • Maternal grandsire (MGS) checking • SNP at a time checking • Haplotype checking more accurate • Breeds moving to accept SNPs in place of microsatellites Who’s your daddy?
MGS detection — HAP method • Based on common haplotypes • After imputation of all loci, determine maternal contribution by removing paternal haplotype • Count maternal haplotypes in common with MGS • Remove haplotypes from MGS and check remaining against maternal great-grandsire (MGGS)
MGS detection — SNP method • Based on SNP conflicts • Check if animal and MGS have opposite homozygotes(duo test) • If sire is genotyped, some heterozygous SNPs can be checked (trio test)
Haplotypes affecting fertility • Rapid discovery of new recessive defects • Large numbers of genotyped animals • Affordable DNA sequencing • Determination of haplotype location • Significant number of homozygous animals expected, but none observed • Narrow suspect region with fine mapping • Use sequence data to find causative mutation
Haplotypes affecting fertility *Causative mutation known
Haplotype tracking of known recessives *Causative mutation known
Progression of chips BovineSNP50 BeadChip (50K) BovineHD BeadChip (777K) Bovine3K BeadChip (3K) Jan Jan Jul 2008 2009 2010 Apr Jan Aug Sep Dec Unofficial 50K evaluations Official 50K Holstein & Jersey evaluations Official 50K Brown Swiss evaluations Unofficial 3K evaluations Official 3K evaluations BovineLD BeadChip (7K) GeneSeek Genomic Profiler (GGP) BeadChip (8K) GGP HD BeadChip (77K) GGP v2 BeadChip (19K) Zoetis LD BeadChip (12K) Affymetrix BOS 1 Plate Array (648K) Jan Sep Feb Dec May Sep 2011 2012 2013 Aug Dec Mar Jan May Oct Official 777K evaluations Official 7K & 648K evaluations Official 8K evaluations Official 77K evaluations Official 19K evaluations Official 12K evaluations
International dairy breeding • Genotype alliances • North America (US, Canada, UK, Italy) • Ireland, New Zealand • Netherlands, Australia • Eurogenomics (Denmark/Sweden/Finland, France, Germany, Netherlands/Belgium, Spain, Poland) • Interbull genomic multitrait across-country evaluation (GMACE)
Impact on breeders • Haplotype and gene tests in selection and mating programs • Trend towards a small number of elite breeders that are investing heavily in genomics • About 30% of young males genotyped directly by breeders since April 2013 • Prices for top genomic heifers can be very high (e.g., $265,000 )
Impact on dairy producers • General • Reduced generation interval • Increased rate of genetic gain • More inbreeding/homozygosity?
Impact on dairy producers (continued) • Sires • Higher average genetic merit of available bulls • More rapid increase in genetic merit for all traits • Larger choice of bulls in terms of traits and semen price • Greater use of young bulls
Conclusions • Genomic evaluation has dramatically changed dairy cattle breeding • Rate of gain is increasing primarily because of a large reduction in generation interval • Genomic research is ongoing • Detect causative genetic variants • Find more haplotypes affecting fertility • Improve accuracy through more SNPs, more predictor animals, and more traits