Download
1 / 44
440 likes | 547 Vues
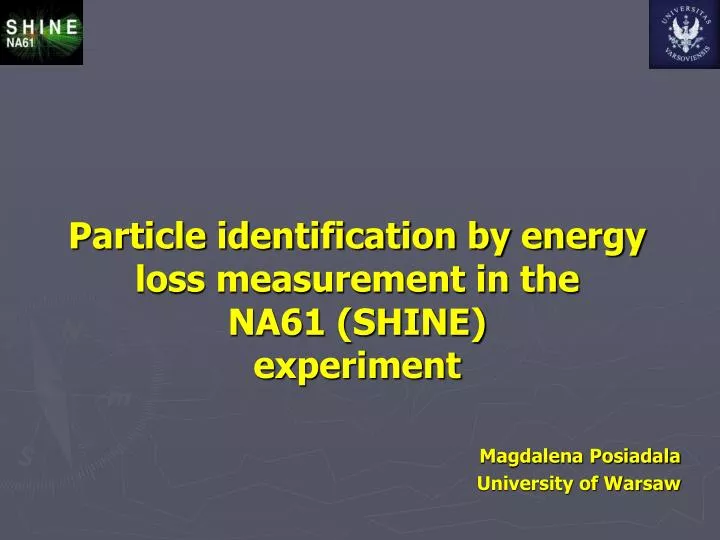
Particle identification by energy loss measurement in the NA61 (SHINE) experiment. Magdalena Posiadala University of Warsaw. Outline:. Energy loss measurements in NA61 experiment at CERN Energy loss parametrisation

E N D
Particle identification by energy loss measurement in the NA61 (SHINE)experiment Magdalena Posiadala University of Warsaw
Outline: • Energy loss measurements in NA61 experiment at CERN • Energy loss parametrisation • Methods of Particle Identification in NA61 in the region of interest for the T2K. • Energy loss measurement in the region below 1GeV/c • Two methods of approach to analysis: • Method 1 – fits done using TMinuit package • Method 2- using probability functions "Neutrino physics at accelerators", JINR, Dubna 27-30.01.2009
NA61 (SHINE) detector Max 72 points Max 90 points TPCs are filled with mixtures of Ar+ CO2(90:10) for VTPCs and (95:5) for MTPCs "Neutrino physics at accelerators", JINR, Dubna 27-30.01.2009
Energy loss measurement • The optimization of the parameters required for the determination of energy loss in the TPCs was performed using the method developed by NA49. (For details see Eur. Phys. J , C45 (2006) 343) • Corrections for the following effects were applied during thecalibration of the NA61 data: • signal loss due to threshold cuts; corrections were obtained using Monte Carlo calculations for gas mixture used in NA61, • time dependence of the TPC gas pressure, • residual time dependence of the measurements (day/night), • charge absorption during the drift, • differences in the TPC sector gain factors, • differences in the amplification of the preamplifiers and edge effects at sectors boundaries. "Neutrino physics at accelerators", JINR, Dubna 27-30.01.2009
Energy loss measurement Preliminary distributions of corrected dE/dx values forpositively (white) and negatively (yellow) charged particles with momentum chosen around 5 and 15 GeV/c. "Neutrino physics at accelerators", JINR, Dubna 27-30.01.2009
Energy loss parametrisation "Neutrino physics at accelerators", JINR, Dubna 27-30.01.2009
Energy loss parametrisation "Neutrino physics at accelerators", JINR, Dubna 27-30.01.2009
dE/dx vs number of measured points on the track 1 island-> vtpc 2 island –> mtpc+vtpc Estimated resolution of dE/dx measurements of 4-5% can be achieved for particles passing through both the vertex and the main TPC chambers. "Neutrino physics at accelerators", JINR, Dubna 27-30.01.2009
Total momentum N>10 N>30 N>40 N>50 "Neutrino physics at accelerators", JINR, Dubna 27-30.01.2009
dE/dx for total momentum p< 2 GeV/c tracks with high dE/dx errors are rejected "Neutrino physics at accelerators", JINR, Dubna 27-30.01.2009
Methods of Particle Identification in NA61 in the region of interest for the T2K • In NA61 (SHINE) experiment particle identification is possible using ionization measurements in active volume of the TPCs and time-of-flight measurements in ToF counters. • For ToF-F measurements see next presentation of Sebastien Murphy. "Neutrino physics at accelerators", JINR, Dubna 27-30.01.2009
Comparison of NA61 data with T2K simulation • JNUBEAM JNUBEAM –simulation of the T2K beam NA61, 2C data, N>30 "Neutrino physics at accelerators", JINR, Dubna 27-30.01.2009
Tracks with and without TOF-F N>30 dE/dx info "Neutrino physics at accelerators", JINR, Dubna 27-30.01.2009
Statistics below 1GeV/c – NA61 Data in % In T2K bins ptot: 200MeV/bin x 50 bins till10GeV/c : 20 rad/bin x 20bins till 0.4 rad "Neutrino physics at accelerators", JINR, Dubna 27-30.01.2009
Statistics for N>30, p<1GeV/c p (GeV/c) "Neutrino physics at accelerators", JINR, Dubna 27-30.01.2009
Statistics below 1GeV/c -2C Data in % "Neutrino physics at accelerators", JINR, Dubna 27-30.01.2009
dE/dx region below 1GeV/c • Preliminary plot ofthe reconstructed dE/dx values versus momenta (p<1.2 GeV) for positively charged particles, together with the Bethe-Bloch curves for positrons,pions, kaons, protons and deuterons. • of dE/dx vs dE/dx "Neutrino physics at accelerators", JINR, Dubna 27-30.01.2009
Smearing with Gaussian theoretical distributions of energy loss • For whole tracks we can calculate theoretical energy loss dE/dxteor using track total momentum and applied parametrisation functions. • In this way we get theoretical distribution of energy loss in momentum bins (see example plot on the right). • Smearing with Gaussian function Example -> dE/dx data "Neutrino physics at accelerators", JINR, Dubna 27-30.01.2009
Smearing with Gaussian theoretical distributions of energy loss (2) • The theoretical distributions of energy loss are smeared with Gaussian function following this rules: • Mean = dE/dxtheor calculated for each track • Sigma = dE/dx for the each track; from NA61 data After Gaussian smearing "Neutrino physics at accelerators", JINR, Dubna 27-30.01.2009
Methods of analysis • Having theoretical energy loss distributions smeared for each of the particle hypotheses I start to extract raw particle yields using 2 methods: • Method 1-> Making fits using TMinuit Package in Root • Method 2 ->Calculating probability functions for 4 particles hypotheses • For more details look at the example in the next few slides. "Neutrino physics at accelerators", JINR, Dubna 27-30.01.2009
Momentum range (0.16-0.3) GeV/c • Preliminary plot of the reconstructed dE/dx values versus momentum (p<1.2 GeV) for positively charged particles, together with the Bethe-Bloch curves for positrons, pions, and only kaons in selectedmomentum range. "Neutrino physics at accelerators", JINR, Dubna 27-30.01.2009
Momentum range (0.16-0.3) GeV/c • We have theoretical smeared with Gaussian energy loss distributions (right) and NA61 data (left) "Neutrino physics at accelerators", JINR, Dubna 27-30.01.2009
Momentum range (0.16-0.3) GeV/c • Method 1 -> uses 2 function for minimization • Theoretical distribution of energy loss is fitted to data • Calculation of the fit parameters ,,, "Neutrino physics at accelerators", JINR, Dubna 27-30.01.2009
Momentum range (0.16-0.3) GeV/c • Method 1 • TMinuit fits • Results "Neutrino physics at accelerators", JINR, Dubna 27-30.01.2009
Momentum range (0.16-0.3) GeV/c • Method 2->Probability functions; for each of the bin i assuming particle hypotheses I calculate probability function defined as: "Neutrino physics at accelerators", JINR, Dubna 27-30.01.2009
Momentum range (0.16-0.3) GeV/c • Method 2-> Multiply probability functions by distribution of the energy loss for the data in selected momentum slice to obtain colourful plots at the bottom picture;corresponding to particle species. "Neutrino physics at accelerators", JINR, Dubna 27-30.01.2009
Momentum range (0.3-0.4) GeV/c "Neutrino physics at accelerators", JINR, Dubna 27-30.01.2009
Momentum range (0.3-0.4) GeV/c • Method 1 • TMinuit fits "Neutrino physics at accelerators", JINR, Dubna 27-30.01.2009
Momentum range (0.3-0.4) GeV/c • Method 2 • Probability functions "Neutrino physics at accelerators", JINR, Dubna 27-30.01.2009
Momentum range (0.5-0.6) GeV/c protons are seen (yellow line) "Neutrino physics at accelerators", JINR, Dubna 27-30.01.2009
Momentum range (0.5-0.6) GeV/c • Method 1 • TMinuit fits "Neutrino physics at accelerators", JINR, Dubna 27-30.01.2009
Momentum range (0.5-0.6) GeV/c • Method 2 • Probability functions Almost the same number of positrons and kaons, which is of course not true. "Neutrino physics at accelerators", JINR, Dubna 27-30.01.2009
Momentum range (0.6-0.7) GeV/c "Neutrino physics at accelerators", JINR, Dubna 27-30.01.2009
Momentum range (0.6-0.7) GeV/c • Method 1 • TMinuit fits "Neutrino physics at accelerators", JINR, Dubna 27-30.01.2009
Momentum range (0.7-0.8) GeV/c "Neutrino physics at accelerators", JINR, Dubna 27-30.01.2009
Momentum range (0.7-0.8) GeV/c • Method 1 • TMinuit fits "Neutrino physics at accelerators", JINR, Dubna 27-30.01.2009
Momentum range (0.8-0.9) GeV/c "Neutrino physics at accelerators", JINR, Dubna 27-30.01.2009
Momentum range (0.8-0.9) GeV/c • Method 1 • TMinuit fits "Neutrino physics at accelerators", JINR, Dubna 27-30.01.2009
Momentum range (0.9-1.1) GeV/c "Neutrino physics at accelerators", JINR, Dubna 27-30.01.2009
Momentum range (0.9-1.1) GeV/c • Method 1 • TMinuit fits "Neutrino physics at accelerators", JINR, Dubna 27-30.01.2009
Momentum range (0.9-1.1) GeV/c • Method 2 • Probability functions Method 2 at this stage of studies works well only for momentum slices where theoretical lines do not cross completely !!! Needs further improvements (/K ratio parameterised by function) "Neutrino physics at accelerators", JINR, Dubna 27-30.01.2009
Summary • The resolution dE/dx strongly depends on number of points per track. For tracks passing through all TPCs the resolution at the level of 4 - 5% . • NA61 data cover acceptance in p, variables for the T2K experiment. • Important dE/dx analysis below 1 GeV/c region. • Presented two methods towards raw particle yields • Method 1 –>making fits using TMinuit package • Method 2 with probability functions still needs improvement->approaching towards max log-likelihood. "Neutrino physics at accelerators", JINR, Dubna 27-30.01.2009
Further steps • On the right relative error vs energy loss distribution is presented. • Next step is to smear theoretical lines with Gaussians that have error equal to relative error of dedx and see how it influences the presented results "Neutrino physics at accelerators", JINR, Dubna 27-30.01.2009