Download
1 / 2
20 likes | 152 Vues
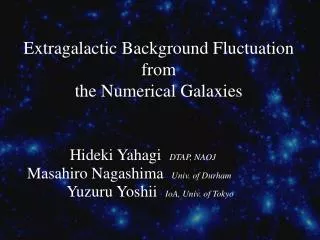
AKARI OBSERVATION OF THE FLUCTUATION OF THE NEAR-INFRARED BACKGROUND. (2011, ApJ,742,124). T. Matsumoto 1,2 , H. J. Seo 1 , W.-S. Jeong 3 , H. M. Lee 1 , S. Matsuura 2 , H. Matsuhara 2 , S. Oyabu 2,4 , J. Pyo 3 , and T. Wada 2. 1 SNU, 2 ISAS, 3 KASI, 4 Nagoya University.

E N D
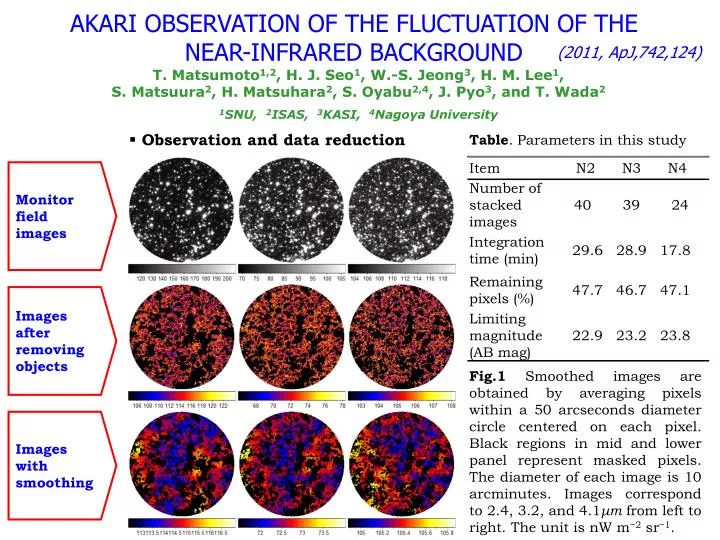
AKARI OBSERVATION OF THE FLUCTUATION OF THE NEAR-INFRARED BACKGROUND (2011, ApJ,742,124) T. Matsumoto1,2, H. J. Seo1, W.-S. Jeong3, H. M. Lee1, S. Matsuura2, H. Matsuhara2, S. Oyabu2,4, J. Pyo3, and T. Wada2 1SNU, 2ISAS, 3KASI, 4Nagoya University • Observation and data reduction Table. Parameters in this study Item N2 N3 N4 Monitor field images Number of stacked images 40 39 24 Integration time (min) 29.6 28.9 17.8 Remaining pixels (%) 47.7 46.7 47.1 Images after removing objects Limiting magnitude (AB mag) 22.9 23.2 23.8 Fig.1Smoothed images are obtained by averaging pixels within a 50 arcseconds diameter circle centered on each pixel. Black regions in mid and lower panel represent masked pixels. The diameter of each image is 10 arcminutes. Images correspond to 2.4, 3.2, and 4.1μm from left to right. The unit is nW m−2 sr−1. Images with smoothing
Fluctuation spectra Fig.2 Fluctuation spectra of mid panel in Fig.1 obtained by two-dimensional FFT. Blue solid lines represent fluctuation spectra of shot noise due to unresolved faint galaxies, which are estimated by simulation. Fig.4 Spectrum of excess fluctuation at large scale (filled circles) is compared with the Spitzer result (squares). • Investigation of foreground • components Fig.3 Correlations between the near-infrared and the far-infrared (90μm). • Zodiacal light : Subset analysis by investigating difference of two sub images shows that the fluctuation spectrum of subset analysis is similar with that of random noise. Moreover, the excess fluctuation is much higher than that expected for zodiacal light at MIR. • Diffuse Galactic light : No correlation with the far-infrared image (Fig.3). • Clustering of low-redshift galaxies : Spectrum of the excess fluctuation is not red but blue (Fig.4). • Summary • We performed a fluctuation analysis for a sky region toward the NEP at 2.4, 3.2, and 4.1μm based on observations with AKARI IRC. • A power spectrum analysis indicates that a significant excess fluctuation exists at an angular scale larger than 100 arcseconds that cannot be explained by foreground components.