Download
1 / 9
90 likes | 289 Vues
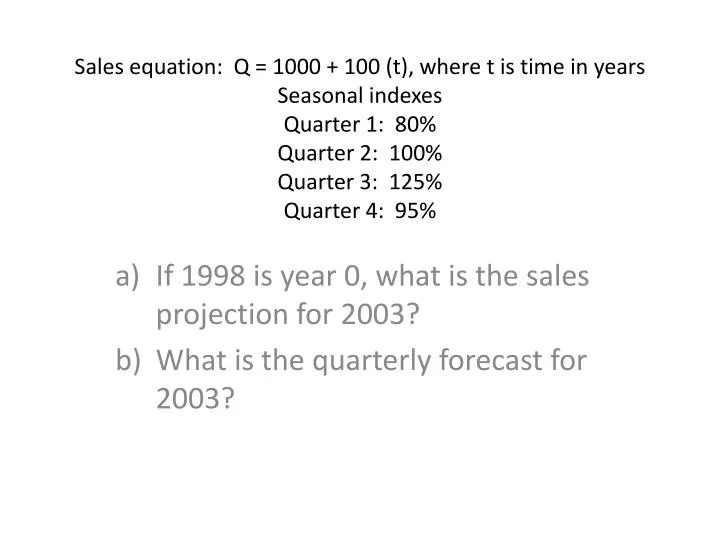
Sales equation: Q = 1000 + 100 (t), where t is time in years Seasonal indexes Quarter 1: 80% Quarter 2: 100% Quarter 3: 125% Quarter 4: 95%. If 1998 is year 0, what is the sales projection for 2003? What is the quarterly forecast for 2003?.

E N D
Sales equation: Q = 1000 + 100 (t), where t is time in yearsSeasonal indexesQuarter 1: 80%Quarter 2: 100%Quarter 3: 125%Quarter 4: 95% If 1998 is year 0, what is the sales projection for 2003? What is the quarterly forecast for 2003?
Sales data for 10 years1993: $230,000 1998: $526,0001994: 276,000 1999: 605,0001995: 328,000 2000: 690,0001996: 388,000 2001: 779,0001997: 453,000 2002: 873,000 • Calculate the compound growth rate for the 10 year period. • Based on this rate, forecast sales for 2003 and 2004 • Calculate the compound growth rate for the period 97-02 • Using this new rate forecast sales for 2003 and 2004 • What is the major reason for the differences in your answers to b and d? If you were to make your own projections, what would you forecast?
Given the following 12 month sales data:January 500 July 610February 520 August 620March 520 Sept 580April 510 Oct 550May 530 Nov 510June 580 Dec 480 • Calculate the 3 month centered moving average. • Use this moving average to forecast sales for January of next year. • If you were asked to forecast January and February of next year, would you be confident using this method? Why or why not?
Given the following sales equation:Q = 10,000 + 60B – 100P + 50Cwhere Q is cabinet sales, B is an index of nonresident construction, P is the price of the cabinet, C is the competitor’s price of their cabinet • If the index is 160, price is 40, and competitor’s price is 35, forecast sales. • What will be the effect if the competitor lower their price to 32? Raises it to 36? • What will happen if this company reacts to the competitor’s lower price by lowering their price to 37? • If the forecast index was wrong, and turned out to be 140, what is the effect?
A retail store has sales of $2.8 million in November and $3.1 million in December. For this firm’s sales November’s index is 95 and December’s is 110. A local paper says sales were depressed in November thanks to a recession, but have rebounded nicely in December, showing a recovery is under way. • Do you agree? • Why or why not?
Linear sales trend of S = 5 + 0.1tt is months from January 1993.Sales in millions of dollars. • A) Forecast sales for February 2001. • B) If there is a seasonal factor involved, with February having an index of 109, how would you adjust this forecast?
Motel room occupancy ratesJan 74.8 July 116.8Feb 79.8 Aug 117.4Mar 92.9 Sep 105.4Apr 108.8 Oct 103.7May 107.5 Nov 100.3Jun 112.0 Dec 80.6 • Is there a pronounced season variation in business? What is the percentage increase of the busiest month over the slowest? • What factors might be responsible for this? • How might you, as manager, use this information?
How do you create a seasonal index? Why would you want to create a seasonal index?
Here’s a sales trend equation: S = 21.3 + 1.3tt is time measured in months from Jan 2002Seasonal indexesJan 103 May 101 Sep 121Feb 80 Jun 104 Oct 101Mar 75 Jul 120 Nov 75Apr 103 Aug 139 Dec 78 • Construct a monthly sale forecast for 2008. • Why would the managers want monthly sales data of this kind?