Download
1 / 24
260 likes | 566 Vues
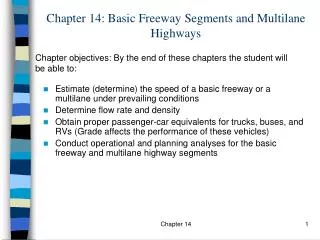
Freeways and Multilane Highways. CTC-340. HMWK. Ch 13 Read Section 13.7 Ch 13 # 2, 3 Ch 14# 1, 4, 5, 6, 8. Capacity. HCM2000 definition

E N D
Freeways and Multilane Highways CTC-340
HMWK • Ch 13 Read Section 13.7 • Ch 13 # 2, 3 • Ch 14# 1, 4, 5, 6, 8
Capacity • HCM2000 definition • The capacity of a facility is the maximum hourly rate at which persons or vehicles can reasonably be expected to traverse a point on a uniform section of a lane or roadway during a given period of time under prevailing roadway, traffic and control conditions
LOS • LOS • Table 13-1 MOEs • Service Flow • Max flow for a given LOS • v/c ratio – ratio of flow to capacity of facility • Should be <1 • If v/c > 1 => congestion
Freeways • Pure uninterrupted flow • Cars enter and exit via ramps • No at grade intersections, driveways etc • Based on number of lanes
Multilane Highways • Only uninterrupted flow if signals at least 2 miles apart • Classified by lanes and median type • F 14.1
LOS • MOE is density – pc/ln/mi • Capacity = 45pc/ln/mi • Freeways • multilane hwys => 40 - 45pc/ln/mi • F 14.2, 14.3, T 14.1 • LOS pg 286 - 290
Freeway Analysis • F14.2 & 14.3 • Operational Analysis • How is the existing facility operating • vp = V/(PHF*N* fHV * fp ) = pc/hr/ln • vp is the demand flow rate under ideal conditions • With vp can find FFS from curves F 14.2 • fp= user population • If V = 4600vph, PHF = 0.90, N =3, fHV =0.87, fp = 1 • What is LOS • v= 1958pc/h/ln => LOS =? F 14.2 &3
Service Flow Rate & Service Vol Analysis • SFi = MSFi*N*fHV*fp • Can find service flow for each LOS i • Use Tables 14.3 or 14.4 to get MSF
Design Analysis • Used to determine # of lanes needed for freeway • To determine the number of lanes • N = DDHV/(PHF*MSF*fHV*fp) • Iterative process • Number of lanes depends on design speed • Design speed depends on # of lanes
Free Flow Speed - Freeways • Free Flow Speed • Found when volume < 1000vph/l • FFS = BFFS-fLW - fLC – 3.22TRD^0.84 • fLW – lane width adjustment T14.5 • fLC – lateral clearance T14.6 • 6’ on right side 2’ on left • Factor only takes right side into account • TRD–total ramp density T14.8 • Total ramps within 3 miles of midpoint of study area/6miles
Multilane Highways • FFS = BFFS-fLW - fLC - fM – fA • fLW – lane width adjustment T14.5 • fLC – lateral clearance T14.7 • Greatest LC = 6 feet on both sides • Undivided Hwys – no median side clearance – taken into account with fM – assume 6’ clearance • TWLTL – assume 6’ clearance • Divided hwy – based on median, dist to opposing traffic, periodic objects(light poles) never more than 6’ • fM –median type T 14.8 • Undivided, TWLTL, divided • fID –access points T14.9 • Driveways or roadways per mile on the right hand side - only include active intersections
Multilane Highways • BFFS – use 60mph if no data available for rural and suburban multilane sites • Can estimate speed limit with BFFS • 7mph higher than spd limits 40 – 45mph • 5mph higher than spd limits 50 – 55mph
Example • Old 6 lane freeway – 11’ lanes, barriers on right side 2’ from pavement edge, TRD = 3ramps/mile • FFS = 75.4- fLW - fLC – 3.22TRD^0.84 • fLW – lane width adjustment T14.5 • fLC – lateral clearance T14.6 • 2’ on right side 6’ on left • Factor only takes right side into account
Example • Old 6 lane freeway – 11’ lanes, barriers on right side 2’ from pavement edge, TRD = 3 ramps/mile • FFS = 75.4- fLW - fLC – 3.22TRD^0.84 • fLW – 1.9 mph T14.5 • fLC – 1.6 mph T14.6 • TRD = 3 • FFS = 75.4 – 1.9 – 1.6 – 3.22*3^.84= 64.1
Example • 4 lane suburban multilane highway – 12’ lanes, barriers on right side 2’ from pavement edge, TWLTL, 30 access points/mile posted spd lmt = 50 mph • FFS = BFFS-fLW - fLC - fM – fA • fLW – 0.0 mph T14.5 • fLC – 0.9 mph T14.7 total LC = 6+2 = 8’ • fM –0.0 mph T 14.8 • fID –7.5 mph T14.9 • FFS = 55 – 0 – 0.9 – 0 – 7.5 = 46.6 • 55 mph 50 + 5 mph for BFFS
Heavy Vehicle Factor • Heavy Vehicle = any vehicle with more than 4 tires • Trucks and buses • Have similar characteristics • Based on a typical mix of trucks • 150#/hp • RVs • Privately owned, self contained or pulled • 75 -100 #/hp
Passenger Car Equivalents • # of cars displaced by the heavy vehicle • ET = PCE for trucks and buses • ER = PCE for RVs • Increases volume to account for HVs • EX: 1000 vehicles 10% trucks, 2% RV • ET = 2.5 ER = 2.0
1000 * 0.1*2.5 = 250pce/hr • 1000*0.02*2 = 40 pce/hr • 1000*0.88 = 880 pce/hr • Total pce = 1170 pce/hr • Traffic stream acts like it has 1170 vph on it • fHV = vph/(pce/hr) always <= 1.0 • fHV = 1000/1170 = 0.85
fHV = 1/(1+PT(ET – 1) +PR(ER – 1)) • Extended Freeway & Multilane Sections • Long section = single section where no grade of 3% or greater is longer than 0.25 miles and if no grade of less than 3% is longer than 0.5 miles
Terrain • Level terrain – short grades less than 2% • HVs can maintain same speed as cars • Rolling terrain - HV speed substantially below pc speeds but do not get to crawl speed for extended periods • Mountainous terrain – HV operate at crawl speed for extended periods or frequently • Rare • T14.11
Specific Grades • Any grade <3% longer than 0.5 miles or >3% and longer than 0.25 mile is a specific grade • T14.12, T14.13 • Trucks on Downgrades T14.14 • RVs same as level sections
Composite Grades • Series of grades • Want to get the equivalent uniform grade for pce • Average grade technique • Find total rise divide by total run • Good when all grades <4% and < 4000ft length • Composite grade technique • Use truck performance curves to determine equivalent length of grade
Driver Population factor • Based on the number of drivers not familiar with the road. • Range from 1 – 0.85 • Usually use 1 unless a field study has been done or it is a highly recreational area