Download
1 / 34
340 likes | 456 Vues
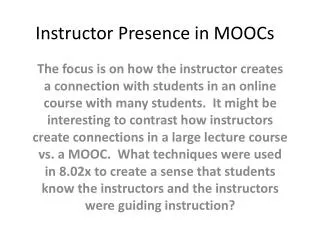
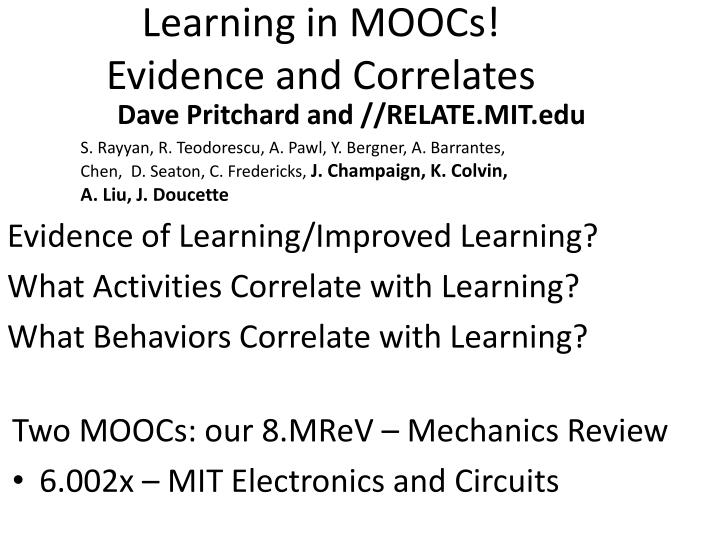
Dave Pritchard and //RELATE.MIT.edu. S. Rayyan, R. Teodorescu, A. Pawl, Y. Bergner, A. Barrantes, Chen, D. Seaton, C. Fredericks, J. Champaign, K. Colvin, A. Liu, J. Doucette. Learning in MOOCs ! Evidence and Correlates. Evidence of Learning/Improved Learning?

E N D
Dave Pritchard and //RELATE.MIT.edu S. Rayyan, R. Teodorescu, A. Pawl, Y. Bergner, A. Barrantes, Chen, D. Seaton, C. Fredericks, J. Champaign, K. Colvin, A. Liu, J. Doucette Learning in MOOCs!Evidence and Correlates • Evidence of Learning/Improved Learning? • What Activities Correlate with Learning? • What Behaviors Correlate with Learning? • Two MOOCs: our 8.MReV – Mechanics Review • 6.002x – MIT Electronics and Circuits
Simple Way to Measure Learning ? • Give Same Test pre- and post- instruction • See if there is Improvement, Gain = (post-pre) 8MReV only
Gain and Normalized Gain (-slope) 100% Forbidden Region: More than 100% on posttest! g is the fraction of unknowns on pretest learned on post test Learn Everything g = 1.00 Gain (= Post – Pre) Normalized Gaing = 0.40 0% Gain (= Post – Pre) Normalized Gain g = Pretest Percentage 0 % 100% 100% - Pre –100%
Gain (posttest – pretest) vs Pretest From R. Hake’s study of 6545 students in 62 classes. HSTop College Normalized Gain =0.3 All Traditional Below Most Interactive Above
Force Questions Gain in 8.MReV MOOC Gain vs Pre-Score: equal Learning for all cohorts g = 0.30± 0.02 6 Items
Non-Force Concept Questions 8.MReV g = 0.33 ± 0.02 5 Items N = 343
Concept and Quantitative 8.MReV g = 0.41± 0.03 7 Items (2 quantitative) N = 176
What & Why Item Response Theory • Measures ability or skill of student • Independent of which Questions Answered • Intrinsic, not extrinsic (like total score) • Sophisticated grading on a curve • In Standard Deviations from Class Average • We use it Two Ways: • Alternate way to analyze pre and post-test • Measure Relative Improvement HW and Tests
IRT Skill Increase PrePost N =579 The key finding here is that the less skillful students learn as much as more skillful students Skill Increase in Course -2.0 -1.0 0.0 1.0 2.0 Average Skill in Course
Summary – Conceptual Learning • Conceptual Learning in 8.MReV slightly greater than traditional on-campus course • None of the various cohorts we studied showed significantly less normalized gain • HS students vs those with advanced degrees • poor prerequisites: math or physics courses • Students of low average skill • Contrary to concerns, no evidence that unskillful, less educated, or less prepared students learn less
Teachers, Non-Teachers, and MIT Students We use 253 questions in both 8.011 and MOOC
Weekly IRT Skill of 8.MReV Various Cohorts versus on-campus students • On-campus students have the advantage of a flipped classroom with MAPS instruction • Hypothesis: They should show steady improvement relative to MOOC students
On-Campus vs 8.MReV Weekly Skills-Does Class Improve Skill? There is no significant relative improvement of the 8.011 students .
8.MReV Where Students Spent Time Students attempting more than 50% of problems (N=1080). Note that cool colors indicate instruction and warm colors indicate assessment
What Correlates with Learning? • Time on Task? • Initial Knowledge? • Study Habits?
The fractional division of time among the various resources of 6.002x Data are for XXXX certificate earners who spent an average of 95 hours on the entire course. Note that cool colors indicate instruction and warm colors indicate assessment
Correlates of Weekly Improvement and Gain • Based on weekly IRT skills (e.g. on a curve) • Find the slope of these: Relative Improvement • Correlate with time on various components • eText, Video, Discussion (instructional) • Checkpoint questions, Homework (assessment)
Correlation Coefficients Visualized -0.62 +0.30 Color Sign FractionNumber
8.MReV Where Students Spent Time Students attempting more than 50% of problems (N=1080). Note that cool colors indicate instruction and warm colors indicate assessment
Posttest-Pretest Gain 8.MReV Measures of Skills and Log of Time on Tasks (N = 292) Average Skill Initial Skill Relative Improvement “Score” in Course Checkpoint Discussion eText Problems Total Time
The fractional division of time among the various resources of 6.002x Data are for XXXX certificate earners who spent an average of 95 hours on the entire course. Note that cool colors indicate instruction and warm colors indicate assessment
Skill Avg Skill Initial 6.002x Measures of Skills and Log of Time on Tasks (n=5948) Relative Improve Score Lecture Questions Homework Video Lab Book Tutorial Discussion Wiki Total Time • Do students who spend more time on Homework have higher skill? • No, negative correlation Do students who spend more time watching lecture videos improve more? No, they improve less
Why Negative correlations!? • More time on HW or Labs more skill? • More skill takes less time to do HW or Lab! • Why do we suppose the same instruction will benefit students widely different in skill? • Maybe we can analyze particular cohorts to find effective instruction for some!
Conclusions and Future • 8.MReV • Positive correlations with conceptual learning • Weaker correlation with Relative Improvement • 6.002x: Broad Range of Skills & Demographics • Strong Negative Correlations with Skills • No significant Correlation with Relative Improve’t • Future: • examine different cohorts • Experimental/Control group experiments • Student Habits & Clusters of Characteristics
Predicting (Classifying) Improvement 8.MReV We used various Machine Learning Algorithms to predict whether students would be above or below average in relative improvement. (50% correct is pure guessing)
Your Measurement Affects the ResultLike Quantum Mechanics, only worse
Closer Look At HomeworkCopying Palazzo, D. et. al. Phys. Rev. ST Phys. Educ. Res. vol. 6, (2010), p. 010104 Symbolic answer: 2.4 Sigma Learning! But no help on conceptual Amount of Symbolic Homework Copied
Symbolic vs. Conceptual Difference! ?? Physics Teacher Expectation • Students Start Symbolic Problems from Conceptual Analysis • Answer Numerical Questions by Plugging in Symbolic answer • The problems cover the same topics, so • This result is Unexpected • Students not Experts
HomeworkCopying Palazzo, D. et. al. Phys. Rev. ST Phys. Educ. Res. vol. 6, (2010), p. 010104 Symbolic answer: 2.4 Sigma Learning! But no help on conceptual • We are only teaching them to answer our examination!! ?? Amount of Symbolic Homework Copied
LORE: Library of Open Research-based Educational Resources • National Research Council: “research-based educational resources produce dramatically better learning outcomes” • Open edX.org MOOC platform • Have content from ~50 universities & organizations • Rapid way to vet assessments • Enables big-data analysis of learning
The LORE Library • Catalog with informative and actionable metadata • Learning Objective • Level & Difficulty, Time to Complete… • Directly assignable and automatically graded • Vetted by trusted process
Library of Research-Based Resources Student MOOC attend Students In class control Vetted Calibrated Library Testing New Education Reseachers & Developers Course builder control Data Mining Psychometrics Teachers attend control Teacher MOOC
Classical Test vs. IRT – MIT data Classical Test Item Response Theory Classical Test Theory Item Response Theory MIT 8.01 Class MasteringPhysics Std. Dev. Above Fraction Correct Chapter Chapter Chapter The IRT graph has less error and shows the trend better: Students selected by SAT scores have an advantage until the fifth week of the course at MIT (vs. second semester in most colleges as claimed by ETS).