Download
1 / 40
400 likes | 486 Vues
Optimal Usage of Water TAIA Lubbock Regional Meeting. Jay Yates Extension Program Specialist III Risk Management Lubbock, TX. Texas Southern High Plains Irrigation Situation. Declining capacity Increased efficiency Increasing energy costs Varieties with higher potential yields.

E N D
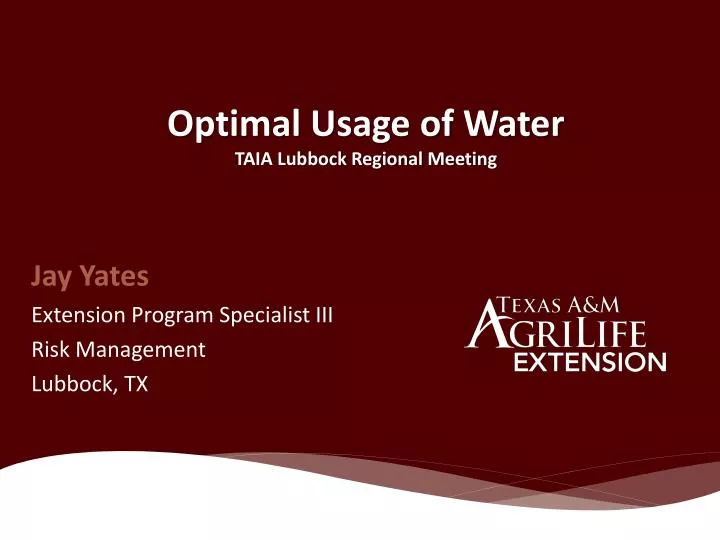
Optimal Usage of WaterTAIA Lubbock Regional Meeting Jay Yates Extension Program Specialist III Risk Management Lubbock, TX
Texas Southern High Plains Irrigation Situation • Declining capacity • Increased efficiency • Increasing energy costs • Varieties with higher potential yields
FARM Assistance Analysis • Looked at the following cotton alternatives: • Fully irrigate 120 acre pivots with 300 gpm each • Irrigate 1/2 pivots, treat the rest as dryland • Irrigate 2/3 pivots, treat the rest as dryland • Drill new wells to irrigate entire pivots on owned land with 600 GPM • Drilling 4 new wells for the 4 pivots on owned land at a cost of $40,000 each • Water ½ pivots on rented ground * None of the alternatives included DCP Program Direct Payments
“Whiskey is for drinkin’, water is for fightin’ over” Mark Twain
Observations From 2011 • TTU Lubbock Mesonet Site • 45.75” Cumulative Reference ET from 4/15 – 9/15 • 2.36” Rainfall during the same period • 98 days of 95 degrees or more • 58 days of 100 degrees or more • Official Lubbock record of 48 breaks old record from 1934 of 29 • 3 bale cotton in 2011 took from 21-35 ac/in with 4-5 gpm per acre capacity • Well irrigated pivots and drip had significantly higher net returns
Petersburg, Texas Dryland planted May 4 – Picture taken August 25, 2011
Shallowater, Texas Pre-watered Only Planted May 4 – Picture taken August 25, 2011
North of Petersburg, Texas Yield .9 BPA Sub-Surface Drip, 1.5 GPM per acre – Picture taken August 25, 2011
Petersburg, Texas Yield 1.5 BPA Sub-Surface Drip, 2.5 GPM per acre – Picture taken August 25, 2011
Lubbock, Texas Yield 3.3 BPA Sub-Surface Drip, 4.1 GPM per acre – Picture taken August 25, 2011
Sandhill, Texas Yield 3.5 BPA Sub-Surface Drip, 4.5 GPM per acre – Picture taken August 25, 2011
South of Shallowater, Texas Yield 3.95 BPA Sub-Surface Drip, 6 GPM per acre – Picture taken August 25, 2011
Not Much Better in 2012 • TTU Lubbock Mesonet Site • 41.13” Cumulative Reference ET from 4/15 – 9/15 • 6.24” Rainfall during the same period • 69 days of 95 degrees or more • 25 days of 100 degrees or more • Official Lubbock record prior to 2011 was 29 from 1934 • Official Lubbock record of 24 tied for 5th most with 1924 • 3 bale cotton in 2012 took only slightly less irrigation than 2011 • Well irrigated pivots and drip had significantly higher net returns
Not as Hot and Dryin 2013But still above average • TTU Lubbock/Reese Mesonet Site • 42.09” Cumulative Reference ET from 4/15 – 9/3 • Would expect another 2.5” over next 2 weeks based on forecasts, making 2013 as high of ET as 2011 • 7.82” Rainfall during the same period • Normal rainfall is 11.24” for this period • 33 of top 36 driest periods on record for Lubbock come between 9/15 and 4/15. (That’s why winter wheat is not as successful here) • 48 days of 95 degrees or more • 13 days of 100 degrees or more • Still warmer than average (~10 days/year), but closer to average temperature compared to the past 2 years.
Comparative Profit Analysis 2011 • Interviewed area farmers • Collected data from AgriLife Research & Extension Projects
The Study Group • 31 Cotton Farm Sites • 17 Sub-Surface Drip (all on 80” centers) • 13 Center Pivots • 2 MESA • 1 LESA • 10 LEPA • 1 Furrow • GPM/Acre ranging from 1.5 to 6.0
2011 Cotton Yields vs. Water Applied Cotton Yield lbs/acre Inches of Water Applied per Acre
2011 Returns Above Direct Costs at $0.90/lb vs. Water Applied at $9/in Returns Above Direct Costs > 4 gpm/ac Inches of Water Applied per Acre
2011 Cotton Net Profit at $0.90/lb vs. Water Applied at $9/in Returns Above Direct Costs > 4 gpm/ac Inches of Water Applied per Acre
2011 Returns Above Direct Costs at $0.52/lb vs. Water Applied at $9/in Returns Above Direct Costs Inches of Water Applied per Acre
2011 Cotton Net Profit at $0.52/lb vs. Water Applied at $9/in Returns Above Direct Costs Inches of Water Applied per Acre
2011 Returns Above Direct Costs at $0.90/lb vs. Water Applied at $15/in Returns Above Direct Costs Inches of Water Applied per Acre
2011 Cotton Net Profit at $0.90/lb vs. Water Applied at $15/in Returns Above Direct Costs Inches of Water Applied per Acre
What Does It Take To Apply 20-25 Inches of Irrigation? * Assumes 125 acre pivot and irrigating season from April 15 to September 15
Conclusions • In 2011 with virtually no sub-soil moisture or rainfall during the growing season, it took at least 4 gpm/acre to make a profitable cotton crop. • Long term analysis shows that systems with the ability to deliver less than 3 gpm/acre would be more profitable cutting irrigated acreage back to that level. • Irrigation profitability is more sensitive to lower cotton prices than higher energy prices. • Expected price level for 2013 would indicate that profitable irrigated yields are still attainable.
Factors Affecting Planting Decisions • Personal Preference • Risk Avoidance • Potential Profitability • Long Term Sustainability
Comparative Farm Scenarios 2013 • Irrigated Acres – 125 • Total Cropland Acres – 160 • Irrigation Capacity – 350 GPM • Number Days to Irrigate – 120 • Acre-inches per Irrigated Acre - 18
Comparative Farm Scenarios 2013 • Scenario 1 • Cotton – Irrigated (950 lb APH, 65%) – 125 ac. • Cotton – Dryland (250 lb APH, 65%) – 35 ac. • Percent Irrigation Capacity Used – 67% • Return Over Direct Expenses - $61,852 • Insurance Coverage Ratio – 109%
Comparative Farm Scenarios 2013 • Scenario 2 • Corn – Irrigated (185 bu APH, 65%) – 62.5 ac. • Sorghum – Irrigated (75 bu APH, 65%) – 62.5 ac. • Sorghum – Dryland (30 buAPH, 65%) – 35 ac. • Percent Irrigation Capacity Used – 93% • Return Over Direct Expenses - $26,015 • Insurance Coverage Ratio – 89%
Comparative Farm Scenarios 2013 • Scenario 3 • Sesame – Irrigated (675 lb APH, 65%) – 125 ac. • Sesame – Dryland (450 lb APH, 65%) – 35 ac. • Percent Irrigation Capacity Used – 62% • Return Over Direct Expenses - $79,040 • Insurance Coverage Ratio – 80%
Comparative Farm Scenarios 2013 • Scenario 4 • Corn – Irrigated (185 bu APH, 65%) – 80 ac. • Sunflowers – Dryland (556 lb APH, 65%) – 80 ac. • Percent Irrigation Capacity Used – 86% • Return Over Direct Expenses - $32,036 • Insurance Coverage Ratio – 86%
Comparative Farm Scenarios 2013 • Scenario 5 • Corn – Irrigated (185 bu APH, 65%) – 80 ac. • Cotton – Dryland (250 lb APH, 65%) – 80 ac. • Percent Irrigation Capacity Used – 86% • Return Over Direct Expenses - $26,910 • Insurance Coverage Ratio – 85%
Comparative Farm Scenarios 2013 • Scenario 6 • Corn – Irrigated (185 bu APH, 65%) – 80 ac. • Sesame – Dryland (450 lb APH, 65%) – 80 ac. • Percent Irrigation Capacity Used – 86% • Return Over Direct Expenses - $34,900 • Insurance Coverage Ratio – 91%
Comparative Farm Scenarios 2013 Insurance Coverage Ratio Irrigation Capacity Usage
Jay Yates Extension Program Specialist III Risk Management FARM Assistance Analyst • Contact Information: • Texas A&M AgriLife Research • and Extension Center • 1102 East FM 1294 • Lubbock, TX 79403 • (806) 746-6101 • jayates@ag.tamu.edu • http://lubbock.tamu.edu • http://agrilife.org/southplainsprofit • http://agrilife.org/southplainscotton • https://www.facebook.com/FARMAssistance South Plains Cotton Update every Thursday at 1:00 – 2:30 p.m. during West Texas Ag Life on