Download
1 / 1
10 likes | 117 Vues
Continental, Landscape, and Ecosystem Scale Fluxes of CO 2 , CO, and other Greenhouse Gases: Constraining Ecosystem Processes from Leaf to Continent (a.k.a. CO 2 Budget Regional Aircraft experiment-Maine [COBRA-ME] ) .

E N D
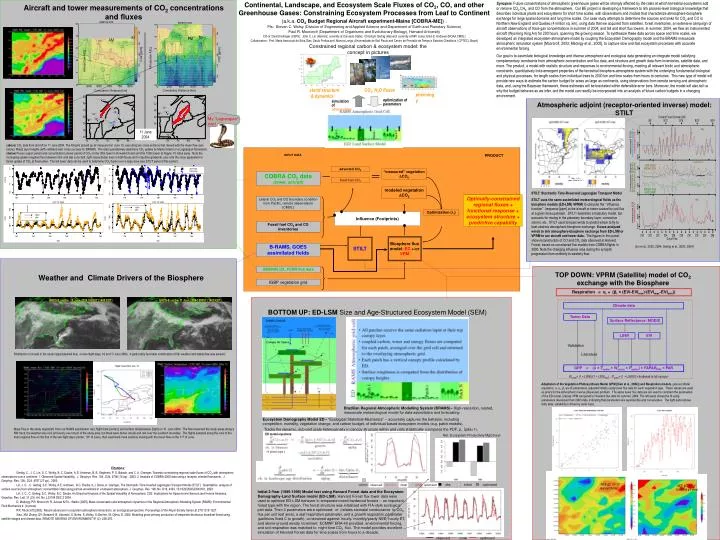
Continental, Landscape, and Ecosystem Scale Fluxes of CO2, CO, and other Greenhouse Gases: Constraining Ecosystem Processes from Leaf to Continent (a.k.a. CO2 Budget Regional Aircraft experiment-Maine [COBRA-ME]) . PIs: Steven C. Wofsy (Division of Engineering and Applied Science and Department of Earth and Planetary Science) Paul R. Moorcroft (Department of Organismic and Evolutionary Biology), Harvard University CO-Is: David Hollinger (USFS); John C. Lin (Harvard; currently at Colorado State); Christoph Gerbig (Harvard; currently at MPI Jena); Arlyn E. Andrews (NOAA CMDL) Collaborators: Prof. Maria Assuncaõ de Silva Dias, Saulo Freitas,and Marcos Longo (Universidade de Saõ Paulo and Centro de Previsão de Tempo e Estudos Climáticos ( CPTEC), Brazil) Synopsis: Future concentrations of atmospheric greenhouse gases will be strongly affected by the rates at which terrestrial ecosystems add or remove CO2,CH4, and CO from the atmosphere. Our BE project is developing a framework to link process-level biological knowledge that describes individual plants and ecosystems for short time scales, with observations and models that characterize atmosphere-biosphere exchange for large spatial domains and long time scales. Our case study attempts to determine the sources and sinks for CO2 and CO in Northern New England and Quebec (4 million sq. km), using data that we acquired from satellites, forest inventories, an extensive campaign of aircraft observations of trace gas concentrations in summer of 2004, and tall and short flux towers. In summer, 2004, we flew an instrumented aircraft (Wyoming King Air) for 200 hours, spanning the growing season. To synthesize these data across space and time scales, we developed an integrated ecosystem-atmosphere model by coupling the Ecosystem Demography model and the BRAMS mesoscale atmospheric simulation system [Moorcroft, 2003; Medvigy et al., 2005], to capture slow and fast ecosystem processes with accurate environmental forcing. Our goal is to assimilate biological knowledge and diverse atmospheric and ecological data generating an integrate model satisfying complementary constraints from atmospheric concentration and flux data, and structure and growth data form inventories, satellite data, and more. The product, a model with realistic structure and responses to environmental forcing, meeting all relevant biotic and atmospheric constraints, quantitatively links emergent properties of the terrestrial biosphere-atmosphere system with the underlying fundamental biological and physical processes, for length scales from individual trees to 2000 km and time scales from hours to centuries. This new type of model will provide new ways to estimate the carbon budget for areas as large as continents, using observations from remote sensing and atmospheric data, and, using the Bayesian framework, these estimates will be bracketed within defensible error bars. Moreover, the model will also tell us why the budget behaves as we infer, and the model can readily be incorporated into an analysis of future carbon budgets in a changing environment. Constrained regional carbon & ecosystem model: the concept in pictures Net Ecosystem Productivity MgC/ha/yr INPUT DATA PRODUCT NEP tC/ha/yr advected CO2 “measured” vegetation DCO2 COBRA CO2 data (tower, aircraft) fossil fuel CO2 modeled vegetation DCO2 Climate data Optimally-constrained regional fluxes + functional response + ecosystem structure + predictive capability Lateral CO2 and CO boundary conditionfrom Pacific, remote observations (CMDL) Optimization (i) Influence (Footprints) Fossil fuel CO2 and CO inventories Tower Data Surface Reflectance: MODIS Biosphere flux model: ED +/or VPM STILT B-RAMS, GOES assimilated fields stand structure & dynamics CO2, H2O fluxes phenology AMERIFLUX, FCRN flux data obs initial optimized LSWI EVI IGBP vegetation grid optimization of parameters CO2 simulation of observables Validation respiration My “Lagrangian” expt Literature of plant type i combust. log10 <<f>>ppm/(mol-m-2s-1) photosynthesis CO GPP = (α × Tscalar × Wscalar× Pscalar) × FAPARPAV× PAR month observed observed initial optimized initial optimized GOES-E visible 10 June 2004 1800UT (1400 EDT) GOES-E visible 11 June 2004 1800UT (1400 EDT) a) AM Altitude [km ASL] Cumulative Distance [km] -NEE gC m-2 d-1 Harvard Forest x Aircraft and tower measurements of CO2 concentrations and fluxes b) PM Altitude [km ASL] Cumulative Distance [km] Atmospheric adjoint (receptor-oriented inverse) model: STILT 11 June 2004 (above) CO2 data from aircraft on 11 June 2004. The King Air picked up air measured on June 10, executing two cross sections that moved with the mean flow (see below). Mixed layer heights (left) validated well, a key success for BRAMS. The data quantitatively determine CO2 uptake by Maine forests in a Lagrangian framework. (below) Fluxes (upper panel) and concentrations (lower panel) of CO2 on the 30m tower in Howland Forest and the 100m tower at Argyle, 10 miles away. Note the increasing uptake (negative flux) between mid- and late June (left, right respectively) seen in both fluxes and in daytime gradients, also note the close agreement in forest uptake of CO2 at these sites. The tall tower data can be used to determine CO2 fluxes over a large area (see STILT panel of this poster). STILT: Stochastic Time-Reversed Lagrangian Transport Model STILT uses the same assimilated meteorological fields as the biosphere models (ED-LSM, VPRM) to compute the “influence function” (response [ppm] at the aircraft or tower caused by unit flux at a given time upstream. STILT resembles a trajectory model, but accounts for mixing in the planetary boundary layer, convective storms, etc.. STILT used forecast winds to predict where to fly to best observe atmosphere-biosphere exchange. It uses analyzed winds to link atmosphere-biosphere exchange from ED-LSM or VPRM to our aircraft and tower data. The figures in this panel show reconstruction of CO and CO2 data observed at Harvard Forest, based on constrained flux models from COBRA flights in 2000. Note the changing influence area during the synoptic progression from northerly to westerly flow. [Lin et al., 2003, 2004; Gerbig et al., 2003, 2004] TOP DOWN: VPRM (Satellite) model of CO2 exchange with the Biosphere Weather and Climate Drivers of the Biosphere Respiration = αr + (βr× (EVI-EVImin)/(EVImax-EVImin)) BOTTOM UP: ED-LSM Size and Age-Structured Ecosystem Model (SEM) Distribution of clouds in the study region(dashed box) on two flight days, 10 and 11 June 2004. A particularly favorable combination of fair weather and stable flow was present. Wscalar= (1 + LSWI)/(1 + LSWImax) ; Pscalar= (1 + LSWI)/2 <budbreak to full canopy> Adaptation of the Vegetation Photosynthesis Model (VPM [Xiao et al., 2004]) and Respiration models. (above) Model equations; a, ar, br are fit parameters, adjusted initially using tower flux data for each vegetation type. These values are used as priors for the atmospheric inverse (Bayesian) problem. The same tower flux data are are used to constrain the parameters of the ED model. (below) VPM compared to Howland flux data for summer, 2004. The left panel shows the fit using parameters developed from 2003 data, indicating that parameters are reproducible and conservative. The right panel shows daily data; variability is driven by solar input. Brazilian Regional Atmospheric Modelling System (BRAMS)– High-resolution, nested, mesoscale meteorological model for data assimilation and forecasting Ecosystem Demography Model ED-- “Ecological Statistical Mechanics” -- accurately captures the behavior, including competition, mortality, vegetation change, and carbon budget, of individual-based ecosystem models (e.g. patch models). Mass Flux in the study region(left, from our RAMS assimilation run), flight track [center], and surface temperatures [right] on 10 June 2004. The flow traversed the study areas along a NW track, the weather was cool and sunny over much of the study area, but there were dense clouds and rain over the southern boundary. The flights sampled along the core of the main regional flow on the first of the two flight days (center, 10th of June), then examined cross sections moving with the mean flow on the 11th of June. Tracks the dynamic, sub-grid scale heterogeneity in canopy structure within grid cells statistically (computes the PDF, p, pda=1). ED model equations: Citations: Gerbig, C., J. C. Lin, S. C. Wofsy, B. C. Daube, A. E. Andrews, B. B. Stephens, P. S. Bakwin, and C. A. Grainger, Towards constraining regional scale fluxes of CO2 with atmospheric observations over a continent: 1. Observed Spatial Variability, J. Geophys. Res. 108,. D24, 4756 (14 pp) , 2003; 2. Analysis of COBRA-2000 data using a receptor oriented framework, J. Geophys. Res. 108,. D24, 4757 (27 pp) , 2003. Lin, J. C. , C. Gerbig, S.C. Wofsy, A.E. Andrews, B.C. Daube, K.J. Davis, A. Grainger, The Stochastic Time-Inverted Lagrangian Transport Model (STILT): Quantitative analysis of surface sources from atmospheric concentration data using particle ensembles in a turbulent atmosphere, J. Geophys. Res. 108, No. D16, 4493, 10.1029/2002JD003161, 2003. Lin, J. C., C. Gerbig, S.C. Wofsy, B.C. Daube, An Empirical Analysis of the Spatial Variability of Atmospheric CO2: Implications for Space-borne Sensors and Inverse Analyses, Geophys. Res. Lett. 31 (23): Art. No. L23104 DEC 2 2004. D. Medvigy, P.R. Moorcroft, R. Avissar & R.L. Walko (2005]. Mass conservation and atmospheric dynamics in the Regional Atmospheric Modeling System (RAMS). Environmental Fluid Mechanics 4: (in press). P.R. Moorcroft (2003). Recent advances in ecosystem-atmosphere interactions: an ecological perspective. Proceedings of the Royal Society Series B, 270:1215-1227. Xiao, XM; Zhang, QY; Braswell, B; Urbanski, S; Boles, S; Wofsy, S; Berrien, M; Ojima, D. 2004. Modeling gross primary production of temperate deciduous broadleaf forest using satellite images and climate data. REMOTE SENSING OF ENVIRONMENT 91 (2): 256-270. -NEE gC m-2 d-1 Howland d Forest Initial 2-Year (1995-1996) Model test using Harvard Forest data and the Ecosystem Demography-Land Surface model (ED-LSM). Harvard Forest flux tower data were used to optimize ED-LSM behavior in temperate mixed hardwood forests -- an important forest type with the region. The forest structure was initialized with FIA-style ecological plot data. Then 3 parameters were optimized: m (relates stomatal conductance to CO2 flux per unit leaf area), a leaf respiration parameter, and a growth respiration parameter (partitions fixed C to growth), constrained against: hourly/ monthly/yearly NEE, hourly ET, and above-ground woody increment. ECMWF ERA-40 provided environmental forcing, and soil respiration was matched to night-time CO2 -flux. The model provides excellent simulation of Harvard Forest data for time scales from hours to a decade. x +