Download
1 / 47
520 likes | 709 Vues
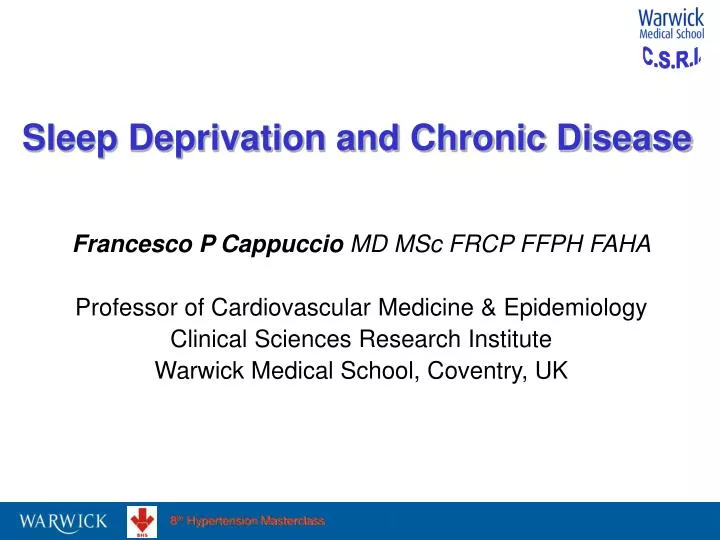
Sleep Deprivation and Chronic Disease. Francesco P Cappuccio MD MSc FRCP FFPH FAHA Professor of Cardiovascular Medicine & Epidemiology Clinical Sciences Research Institute Warwick Medical School, Coventry, UK. 50. 0. How many hours per night do you usually sleep?. Less than 5h 6h 7h 8h

E N D
Sleep Deprivation and Chronic Disease Francesco P CappuccioMD MSc FRCP FFPH FAHA Professor of Cardiovascular Medicine & Epidemiology Clinical Sciences Research Institute Warwick Medical School, Coventry, UK
50 0 How many hours per night do you usually sleep? • Less than 5h • 6h • 7h • 8h • 9h or more
Sleep Duration Time Trends in US Adults Hrs per night National Sleep Foundation. Sleep in America Poll
1967 2003 Sleep duration in British Adults (1967/2003) Groeger JA et al. J Sleep Res. 2004; 13:359-71
50 0 How much did you score at the ESS questionnaire? • 10 or less • 11-16 • 17 or more
Insufficient Sleep (Sleep Deprivation) Fragmented Sleep (Sleep Disruption) Excessive Daytime Sleepiness (EDS) Neurobehavioral deficits cognitive/executive function attention/concentration Performance deficits errors/accuracy Cardio-metabolic appetite regulation high blood pressure Increased Morbidity / Mortality Decreased Quality of Life
Short Sleep Duration & Chronic Diseases • Cardio-Metabolic Risk Factors • Obesity/body fat distribution • Type 2 Diabetes Mellitus • Hypertension • Total and Cause-Specific Mortality • Coronary Heart Disease
Cardio-Metabolic Risk Factors: Obesity
Obesity Epidemic and Sleep Duration BMI in US adults Sleep duration in US adults
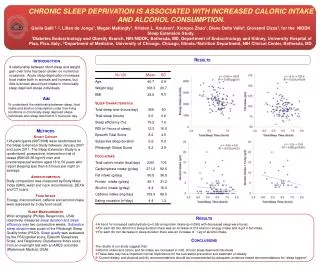
-15.5% +14.9% Short Sleep Duration and Metabolic Hormones Leptin Ghrelin Taheri S et al. PLoS Med. 2004; 1:210-7
-18% leptin; +28% ghrelin +24% hunger/appetite Sleep Deprivation and Appetite Regulation Spiegel K et al. Ann Intern Med. 2004; 141:846-50
1.89 (1.46-2.43) OR & 95% CI 2.25 (1.27; 3.98) 11.00 (4.75; 25.49) 1.19 (1.00; 1.42) 2.17 (1.57; 3.00) 2.00 (0.80; 5.02) 5.63 (0.72; 44.06) 1.15 (0.93; 1.43) 1.45 (1.20; 1.76) 2.63 (1.24; 5.58) 1.75 (1.28; 2.39) 2.23 (0.87; 5.73) Short Sleep Duration (<10h) and ObesityMeta-analysis of Cross-Sectional Studies Children, n=29,502 Cappuccio FP et al. Sleep 2008; in press
1.55 (1.43-1.68) Short Sleep Duration (<5h) and ObesityMeta-analysis of Cross-Sectional Studies Adults, n=603,519 OR & 95% CI 3.36 (2.24; 5.03) 1.98 (1.03; 3.81) 1.52 (1.46; 1.58) 1.38 (0.98; 1.95) 10.80 (0.99; 117.4) 1.52 (0.68; 3.41) 1.84 (1.40; 2.41) 1.38 (1.06; 1.79) 0.95 (0.67; 1.34) 1.70 (1.26; 2.29) 1.22 (1.07; 1.40) 1.43 (1.34; 1.52) 1.96 (1.19; 3.22) 2.98 (0.77; 11.57) 1.87 (1.22; 2.86) 4.01 (1.72; 9.34) 2.65 (1.27; 5.54) 1.30 (1.14; 1.48) 1.30 (1.06; 1.60) 1.46 (1.13; 1.88) 1.75 (1.36; 2.25) 2.02 (1.57; 2.60) Cappuccio FP et al. Sleep 2008; in press
Sleep Deprivation & Obesity:Potential Mechanisms Sleep Deprivation Obesity Patel SR et al. Obesity; 2008; in press
1.65 (1.22-2.24) -0.35 (-0.57;-0.12) P <0.001 Short Sleep Duration and ObesityThe Whitehall II Study/Cross-Sectional (n=5,021) BMI OR Obesity Stranges S et al. Am J Epidemiol. 2008; 167: 321-9
1.05 (0.60-1.82) 0.03 (-0.03; 0.08) P = 0.36 Short Sleep Duration and ObesityThe Whitehall II Study/Prospective BMI OR Obesity Stranges S et al. Am J Epidemiol. 2008; 167: 321-9
Cardio-Metabolic Risk Factors: Type 2 Diabetes
1.95 (0.95-4.01) 3.12 (1.53-6.37) Sleep Duration and Risk of DiabetesThe Massachusetts Male Aging Study (n=1,139) Yaggi HK et al. Diabetes Care 2006; 29:657-61
1.18 (0.96-1.44) 1.29 (1.05-1.59) Sleep Duration and Risk of DiabetesThe Nurses’ Health Study (n=70,026) Ayas NT et al. Diabetes Care 2003; 26:380-4
Elevation of evening cortisol levels predisposing to insulin resistance Increase in sympathetic tone, inhibiting pancreatic function and leading to increased glucose intolerance Weight gain and reduction in leptin Reduction of testosterone levels Sleep Deprivation & Diabetes:Potential Mechanisms
Cardio-Metabolic Risk Factors: Hypertension
1.60 (1.19-2.14) Sleep duration and incidentHypertension NHANES-I Men & Women, 32-59 years, n=3,620 Gangwish JE et al. Hypertension 2006; 47:833-9
1.72 (1.07-2.75) Sleep duration and prevalent HypertensionThe Whitehall II Study Women, n=1,567 P = 0.037 Men, n=4,199 Hours sleep Cappuccio FP et al. Hypertension 2007:50:694-701
Sleep duration and incidentHypertensionThe Whitehall II Study Women, n=1,005 Men, n=2,686 Hours sleep Cappuccio FP et al. Hypertension 2007:50:694-701
1.61 (1.08-2.41) Sleep duration and prevalent HypertensionThe Western New York Health Study Women, n=1,710 Men, n=1,317 <6 6-8 >8 Hours sleep Stranges S et al. 2008; (under review)
Increased BP load resulting from prolongation of higher BP whilst awake Truncation of the BP dip during sleep Prolonged activation of sympathetic nervous system Increased renal sodium retention Gender-specific effects? Confounding? Sleep Deprivation & Hypertension:Potential Mechanisms
Women, n=636,095 Men, n=480,841 The U-Shaped Association between Sleep Duration and TotalMortalityThe Cancer Prevention Study II Kripke DF et al. Arch Gen Psychiatry 2002;59:131-136
Phase 1 (1985-88) n=9,781 Phase 3 (1991-93) n=7,729 Hazard Ratio (95% CI) Hazard Ratio (95% CI) Age-adjusted Fully adjusted Age-adjusted Fully adjusted > 9h (7 deaths) > 9h (16 deaths) < 5h (29 deaths) < 5h (56 deaths) 6h (160 deaths) 6h (61 deaths) 7h (256 deaths) 7h (112 deaths) 8h (87 deaths) 8h (74 deaths) All-Cause mortality by hours of sleepThe Whitehall II Study Ferrie JE et al. Sleep 2007; 30:1659-66
Hazard Ratio (95% CI) Increase from 5 or 6h (55 deaths) Decrease from 6, 7 or 8h (57 deaths) Increase from 7 or 8h (58 deaths) All-Cause mortality from Phase 3 by changes in hours sleep between Phase 1 and Phase 3 Age-adjusted Fully adjusted Ferrie JE et al. Sleep 2007; 30:1659-66
Hazard Ratio (95% CI) Increase from 5 or 6h (16 deaths) Decrease from 6, 7 or 8h (24 deaths) Increase from 7 or 8h (12 deaths) CVD mortality from Phase 3 by changes in hours sleep between Phase 1 and Phase 3 Age-adjusted Fully adjusted Ferrie JE et al. Sleep 2007; 30:1659-66
Hazard Ratio (95% CI) Increase from 5 or 6h (38 deaths) Decrease from 6, 7 or 8h (33 deaths) Increase from 7 or 8h (45 deaths) Non-CVD mortality from Phase 3 by changes in hours sleep between Phase 1 and Phase 3 Age-adjusted Fully adjusted Ferrie JE et al. Sleep 2007; 30:1659-66
Summary • Either a decrease in sleep duration from a regular 6, 7 or 8h per night or an increase from a regular 7 or 8h per night predict all-cause mortality • A decrease in sleep duration affects all-cause mortality via increases in cardiovascular deaths • An increase in sleep duration affects overall mortality via an increase in non-cardiovascular deaths • Sleep changes over time may represent more reliable measures to assess the impact of sleep on health
2.98 (1.48-6.03) Women, n=3,388 Men, n=3,508 Hours sleep Coronary Heart Disease by hours of sleepThe MONICA Study Meisinger C et al. Sleep 2007; 30:1121-27
1.45 (1.10-1.92) 1.38 (1.03-1.86) Coronary Heart Disease by hours of sleepThe Nurses’ Health Study Women, n=71,617 Hours sleep Ayas NT et al. Arch Intern Med 2003; 163:205-9
Summary • Both short and long sleep duration may be associated with more detrimental effects on cardiovascular health in women than men • The biological mechanisms underlying these associations are unclear • High blood pressure may represent one mechanism linking short sleep duration with increased risk of CHD, at least in women
Unresolved issues • Co-morbidities of sleep disorders (psychiatric/chronic conditions) • Bidirectional relationship (reverse causality/temporality?) • Confounding by other lifestyle behaviors • Sleep as marker of health status vs. risk factor • Biological plausibility • Objective assessment of sleep changes over time
SLEEP, HEALTH & SOCIETY University of Warwick Medical School sleepresearch@warwick.ac.uk Leads: FP Cappuccio & E Peile Warwick Team: MA Miller, S Stranges, N-B Kandala, FM Taggart, C Ji, A Currie, G Ward, A Bakewell, A Lowe, D Cooper Collaborators: Warwick: S Williams, D Banejee, RCP: R Pounder UCL: MG Marmot, E Brunner, M Kumari, M Shipley, JE Ferrie Surrey: D-J Djik, S Archer Harvard: C Czeisler, S Lockley, C Landrigan Naples: P Strazzullo, G Barba Buffalo: JM Dorn, RP Donahue, M Trevisan Funding: Cephalon Inc., Wingate Foundation, Whitehall II, RDF University of Warwick, NHS Workforce
Average sleep duration in a survey of ~2,000 British Adults Groeger JA et al. J Sleep Res. 2004; 13:359-71
Co-morbidities of Sleep Disorders Foley D et al. Psychosom Res. 2004; 56:497-502
-0.35 (-0.57;-0.12) Sleep Duration and BMIMeta-analysis of Cross-Sectional Studies β & 95% CI -0.60 (-0.75; -0.45) -0.01 (-0.03; 0.00) -0.45 (-0.71; -0.19) -0.18 (-0.36; 0.00) -0.36 (-0.52;-0.20) -0.52 (-0.86; -0.18) -0.39 (-0.51; -0.27) Adults, n=16,509 Equivalent to approx 1.4 kg per hour Cappuccio FP et al. Sleep 2008; in press
less more LACK OF SLEEP Gale SM et al. J Nutr 2004; 134:295-8
Need for further research… • Objective assessment of sleep changes over time • More prospective evidence • Better understanding of determinants of sleep duration • Better control for confounders/co-morbidities • Experimental evidence on biological plausibility
Low SES/Unhealthy lifestyle/ Poor general health status Co-Morbidities/Elderly Short sleep duration Long sleep duration Appetite dysregulation/ Impaired glucose homeostasis Depression/ Poor general health status Inflammatory/neurovegatative/ hormonal responses CVD/Metabolic alterations Increased morbidity/mortality/ Reduced quality of life Putative pathways
Sleep Deprivation & Diabetes:Potential Mechanisms Acute sleep deprivation Chronic sleep deprivation Diabetes Spiegel K et al. J Appl Physiol. 2005; 99: 2008-19