Download
1 / 39
390 likes | 525 Vues
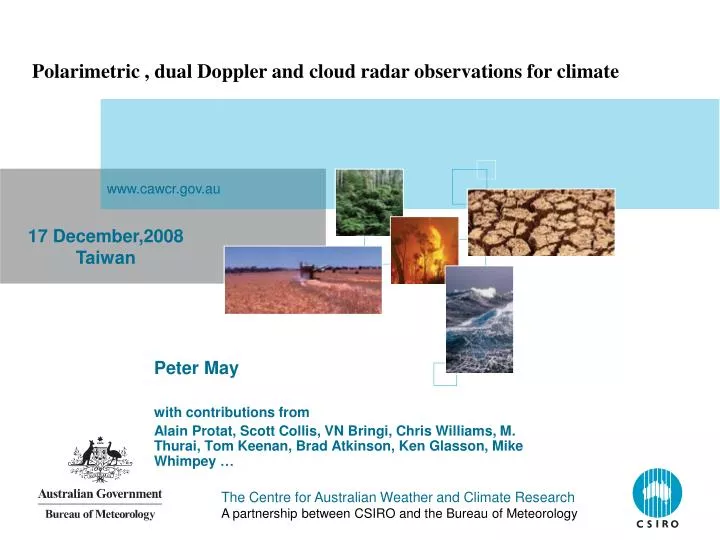
Polarimetric , dual Doppler and cloud radar observations for climate. www.cawcr.gov.au. 17 December,2008 Taiwan. Peter May with contributions from Alain Protat, Scott Collis, VN Bringi, Chris Williams, M. Thurai, Tom Keenan, Brad Atkinson, Ken Glasson, Mike Whimpey …. Background.

E N D
Polarimetric , dual Doppler and cloud radar observations for climate www.cawcr.gov.au 17 December,2008 Taiwan Peter May with contributions from Alain Protat, Scott Collis, VN Bringi, Chris Williams, M. Thurai, Tom Keenan, Brad Atkinson, Ken Glasson, Mike Whimpey …
Background • Centre for Australian Weather and Climate Research • A partnership between the Bureau of Meteorology (old BMRC) • CSIRO (parts of CSIRO Marine and Atmospheric Research) • ~ 250 scientists at 4 main sites (Melbourne, Aspendale, Canberra, Hobart) • Tackling Earth System Science: • World class Earth system numerical modelling (NWP and Climate) • World class observations that inform decisions • Understand, characterise and preedict the water cycle in Australia The Centre for Australian Weather and Climate ResearchA partnership between CSIRO and the Bureau of Meteorology
Polarimetric radar applications • Projects on nowcasting • QPE and precipitation microphysics for both weather and climate • Cloud process studies including dual Doppler • Cloud statistics (cloud radar, profilers and weather radar) • Model validation • Two sites: • Darwin Climate Research Station • CP 2 Radar in Brisbane The Centre for Australian Weather and Climate ResearchA partnership between CSIRO and the Bureau of Meteorology
Capability for DSD’s From Bringi et al (submitted) Compare DDSD from profiler and C-POL Builds on Williams and May, 2008 The Centre for Australian Weather and Climate ResearchA partnership between CSIRO and the Bureau of Meteorology
D0 histograms for the Monsoon regime (left panel) and the build up phase (right panel). In both cases, the dashed line represents the regions identified as being convective and the solid line represents the regions identified as being stratiform in the CPOL (a) (b) Just one example, extending to large sample, to examine regime dependence, Land/ocean statistics, potential aerosol impacts, BL impacts The Centre for Australian Weather and Climate ResearchA partnership between CSIRO and the Bureau of Meteorology
Microphysical classification with polarimetric radar Use combinations of estimators and fuzzy logic to estimate most Likely hydrometeor type: Z: 45-80dBZ ZDR: -1-6 dB ρHV(0): >0.9 KDP: 0-20 o/km T: -10 – 10oC Rain/hail mix Classification types: Drizzle Rain Snow (dry low density) Snow (dry high density) Snow(melting) Graupel (dry) Graupel (wet) Hail (D < 2 cm) Hail (D > 2cm) Rain/Hail mix
Example of C-pol classification Rain Rain/hail mix and wet graupel
Microphysical classification : 4 Nov. 2001 Mis-classification of melting aggregates Strongest updraft in cloud, but on edge of heavy precipitation Over-turning at top of updraft Rain/hail mix and graupel Brightband contamination High fall speeds imply graupel and hail Evaporation of drops in downdraft part of overturning sample produces apparent upward moving drops
µphysics + Multi Doppler Synthesis • Uses a variational method based on the work by Protat and Zawadzki (see Protat, A. and I. Zawadzki 1999: A semi-adjoint method for real time retrieval of three-dimensional wind field from multiple-Doppler bistatic radar network data. J. Atmos. Oceanic Tech., 16, 432-449 ) • Retrieval of U and V components is performed by minimising difference between guess fields and measurements • Retrieval of W is performed by minimising difference between guess field and W derived from the integration of the anelastic mass continuity equitation (one of the adjoint models) The Centre for Australian Weather and Climate ResearchA partnership between CSIRO and the Bureau of Meteorology
Sample result The Centre for Australian Weather and Climate ResearchA partnership between CSIRO and the Bureau of Meteorology
The Centre for Australian Weather and Climate ResearchA partnership between CSIRO and the Bureau of Meteorology
The Centre for Australian Weather and Climate ResearchA partnership between CSIRO and the Bureau of Meteorology
The Centre for Australian Weather and Climate ResearchA partnership between CSIRO and the Bureau of Meteorology
The Centre for Australian Weather and Climate ResearchA partnership between CSIRO and the Bureau of Meteorology
The Centre for Australian Weather and Climate ResearchA partnership between CSIRO and the Bureau of Meteorology
The Centre for Australian Weather and Climate ResearchA partnership between CSIRO and the Bureau of Meteorology
Convective Core statistics CRM comparison From Jing Bo, NASA GISS The Centre for Australian Weather and Climate ResearchA partnership between CSIRO and the Bureau of Meteorology
More weather radar applications • Examine environmental controls • Model validation The Centre for Australian Weather and Climate ResearchA partnership between CSIRO and the Bureau of Meteorology
New Products – “3D coverage product” Taking grids and calculating areal statistics as a function of height and time, e.g. area Z> 10 dBZ, snow area etc Metrics of cloud cover, convective activity … • Interpolate the radar reflectivity and • microphysical classifications from the • polarimetric radar data onto a • Cartesian grid and run a forward • reflectivity calculation on the model • fields to produce a matching grid. • At each altitude level of the grid • calculate: • The fraction of the total area • covered by Z> [10, 20, 30, 40] dBZ • The fraction of the total area • covered by rain, snow, graupel, hail • The maximum reflectivity • anywhere in the grid
SCM product • . Examples of observed reflectivity fields and how they map onto the SCP product. The reflectivity fields are CAPPI (reflectivity fields at a constant altitude) for 11 km (0750 UT) and 3 km (0630 UT) on 10 February, 2006. The 10 dBZ (40 dBZ) fraction at these times and heights are 34.7 % and 4.4 % respectively. The Centre for Australian Weather and Climate ResearchA partnership between CSIRO and the Bureau of Meteorology
Application for cloud physics • Look at statistics for island thunderstorms to study question of what • Controls thunderstorm characteristics? • Similar forcing, just sort by environment i.e CAPE, CIN, Shear, aerosol • Note CAPE, shear and aerosol are independent, CAPE-CIN correlated • In press May et al ACP, 2008 The Centre for Australian Weather and Climate ResearchA partnership between CSIRO and the Bureau of Meteorology
Application for cloud physics • Sorted by CAPE The Centre for Australian Weather and Climate ResearchA partnership between CSIRO and the Bureau of Meteorology
Sorted by CIN The Centre for Australian Weather and Climate ResearchA partnership between CSIRO and the Bureau of Meteorology
Sorted by shear The Centre for Australian Weather and Climate ResearchA partnership between CSIRO and the Bureau of Meteorology
Sorted by aerosol The Centre for Australian Weather and Climate ResearchA partnership between CSIRO and the Bureau of Meteorology
So is there an aerosol effect? • But thermodynamics are also different. The Centre for Australian Weather and Climate ResearchA partnership between CSIRO and the Bureau of Meteorology
`Application for model testing • Radar Observations Model statistics The Centre for Australian Weather and Climate ResearchA partnership between CSIRO and the Bureau of Meteorology
Statistical approach for radar analysis • Time series of the domain average total rain rate (solid) and convective rain rate (dotted) for the radar observations (top panel) and model simulations (lower panel). The time axis has been shifted by 4 hours for the models to bring them into reasonable phase agreement as discussed in the May and Lane 2008. The Centre for Australian Weather and Climate ResearchA partnership between CSIRO and the Bureau of Meteorology
Summary of section • Robust detailed kinematic and microphysical descriptions of storm systems in 4D • Useful for case studies and statistical analysis • Statistics : To describe regime dependence for better understanding Paramaterisation development Model testing The Centre for Australian Weather and Climate ResearchA partnership between CSIRO and the Bureau of Meteorology
Cloud radar profiles: Motivation Characterize the tropical ice cloud properties from different radar-lidar observations at different sites : • to evaluate the variability of these properties along the tropical belt, as a function of large-scale environment, cloud regime, in the vertical, interannual, etc … • to better understand the cloud / radiation feedback mechanisms • to provide an observational basis for model evaluation • to provide a reference to evaluate new spaceborne sensors (A-Train) The Centre for Australian Weather and Climate ResearchA partnership between CSIRO and the Bureau of Meteorology
Ground-based radar-lidar observations • ARM Sites : Darwin 2006/2007 monsoon season (other seasons soon for interannual variability) • AMF Sites : Niamey (West-Africa, 2006 monsoon season) Mather et al. (2007) and Mace et al. (2006) already documented the Manus and Nauru ARM sites – this study adds up two sites. Radars are degraded to the same sensitivity in all comparisons “Ice cloud” and “convective ice” profiles are separated in both datasets Which radius should we consider around these sites ? Impact of diurnal cycle of cloud properties around these sites ? The Centre for Australian Weather and Climate ResearchA partnership between CSIRO and the Bureau of Meteorology
Darwin vs Niamey • Compare statistics from two tropical sites • 1. Darwin – coastal monsoon environment • Intense storm activity is nearby • 2. Niamey, Niger – inland for AMMA • Most intense storms in Congo to the east, cloud systems propagate in • Compare the two – monsoon vs continental, site representativeness for CLOUDSAT interpretation, Diurnal cycles, radiative differences etc. The Centre for Australian Weather and Climate ResearchA partnership between CSIRO and the Bureau of Meteorology
Frequency of Ice Cloud Occurrence Similar profiles but very large difference The Centre for Australian Weather and Climate ResearchA partnership between CSIRO and the Bureau of Meteorology
Ice Cloud Fraction Cloud fraction corresponds to the UM model (12 km horizontal, 50 vertical levels) which will be used for regional Australian forecast from January 2009 Both sites are characterized by similar cloud fraction distributions (0.05 to 0.3 / 0.9 to 1) Main differences are in the upper-levels (more high CFs in Darwin cirrus) and above melting layer (more small CFs in Darwin) A large-scale model should be able to reproduce that The Centre for Australian Weather and Climate ResearchA partnership between CSIRO and the Bureau of Meteorology
Ice Cloud Top Height, Base, Thickness The Centre for Australian Weather and Climate ResearchA partnership between CSIRO and the Bureau of Meteorology
Microphysical Properties PDFs Mean Vertical Profiles Microphysical processes - Two regions From top to 8 km – aggregation dominating From 8 km to Melting Layer – sublimation dominating Darwin vs Niamey : ice clouds over Niamey consist of smaller-sized particles but in much larger concentrations, thereby carrying more ice water and producing more visible extinction than the ice clouds over Darwin. Heating rates ? The Centre for Australian Weather and Climate ResearchA partnership between CSIRO and the Bureau of Meteorology
Climate observations with radar • Fundamental cloud physics: DSD, cloud properties, kinematics • Model testing and diagnosis The Centre for Australian Weather and Climate ResearchA partnership between CSIRO and the Bureau of Meteorology
Thank you The Centre for Australian Weather and Climate Research A partnership between CSIRO and the Bureau of Meteorology Peter May Phone: +61 3 9669 4490 Email: a.protat@bom.gov.au Web: www.cawcr.gov.au Thank you www.cawcr.gov.au


![SCIENCE OPS [contributions from Peter, Trey, Dom, Kristen, Kristina and Mike]](https://cdn2.slideserve.com/4197460/science-ops-contributions-from-peter-trey-dom-kristen-kristina-and-mike-dt.jpg)