1 / 1

Supplemental Digital Content 2 - Figure 2: Scatter plots of biomarker candidates

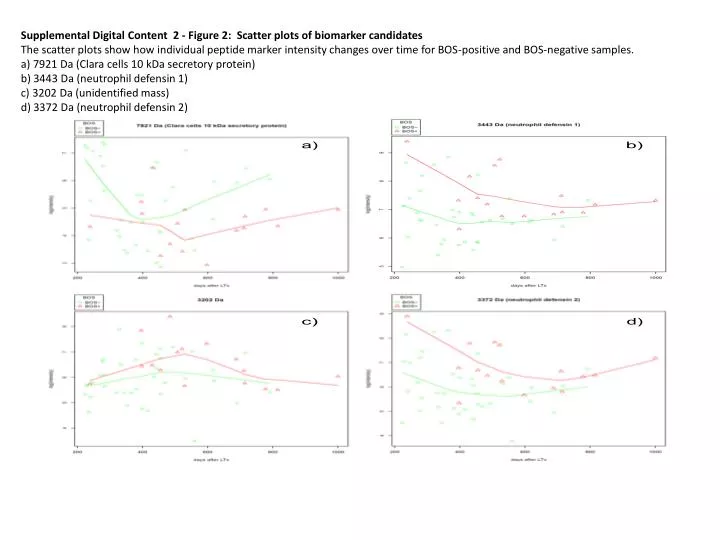
a). b). c). d). Supplemental Digital Content 2 - Figure 2: Scatter plots of biomarker candidates

tab
Télécharger la présentation

Supplemental Digital Content 2 - Figure 2: Scatter plots of biomarker candidates

An Image/Link below is provided (as is) to download presentation Download Policy: Content on the Website is provided to you AS IS for your information and personal use and may not be sold / licensed / shared on other websites without getting consent from its author. Content is provided to you AS IS for your information and personal use only. Download presentation by click this link. While downloading, if for some reason you are not able to download a presentation, the publisher may have deleted the file from their server. During download, if you can't get a presentation, the file might be deleted by the publisher.

E N D

Presentation Transcript


  1. a) b) c) d) Supplemental Digital Content 2 - Figure 2: Scatter plots of biomarker candidates The scatter plots show how individual peptide marker intensity changes over time for BOS-positive and BOS-negative samples.a) 7921 Da (Clara cells 10 kDasecretory protein) b) 3443 Da (neutrophildefensin 1) c) 3202 Da (unidentified mass)d) 3372 Da (neutrophildefensin 2)

More Related