Download
1 / 13
140 likes | 623 Vues
MISLEADING GRAPHS. Powerpoint by Leah Montange Lesson by Leah Montange and Daniel Perry. EALR’s and GLE’s. Grade Level: Grade 4 EALR: 3. The student uses mathematical reasoning. Component: 3.1 Analyze information.

E N D
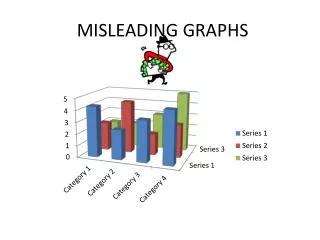
MISLEADING GRAPHS Powerpoint by Leah Montange Lesson by Leah Montange and Daniel Perry
EALR’s and GLE’s • Grade Level: Grade 4 • EALR: 3. The student uses mathematical reasoning. • Component: 3.1 Analyze information. • GLE: 3.1.1 Analyze and compare numerical, measurement, geometric, and/or statistical information in familiar situations. • EX: Differentiate between a valid and invalid comparison of mathematical information or results.
Learning Objectives • Students will be able to identify whether graphs are misleading. • Students will be able to identify the factors that can make bar graphs, line graphs, and scatter plots misleading. • Students will be able to interpret whose interests are favored by misleading graphs.
Think About It: • What is misleading about this graph? • How could the graph be changed to reflect the data more accurately? • Why would someone make a graph that is misleading in this way?
The same data: www.mediamatters.org/items/200503220005
Factors that make a graph misleading: • Y-axis scale is too big or too small • Y-axis skips numbers, or does not start at zero • X-axis scale is too big or too small • X-axis skips numbers, or does not start at zero • Axes are not labeled • Data is left out • What else?
Think Pair Share • What is misleading about this graph? • How could the graph be changed to reflect the data more accurately? • Why would someone make a graph that is misleading in this way?
Activity Time • Gather class data • Make a class data table • Individually graph it: • Accurate graph • Misleading graph
Interdisciplinary Connections: Media Literacy Accommodation Notes: Opportunity to express socioeconomic class-related perspectives on the validity of data (See Trentatosta, p. 48)
Notes on Pedagogy: Empowerment of students to be able to read the world. We made a point of: • Using real published graphs from news sources, advertisements, reports, etc. • Having the class create misleading graphs using real data that the class generates