Download
1 / 7
70 likes | 211 Vues
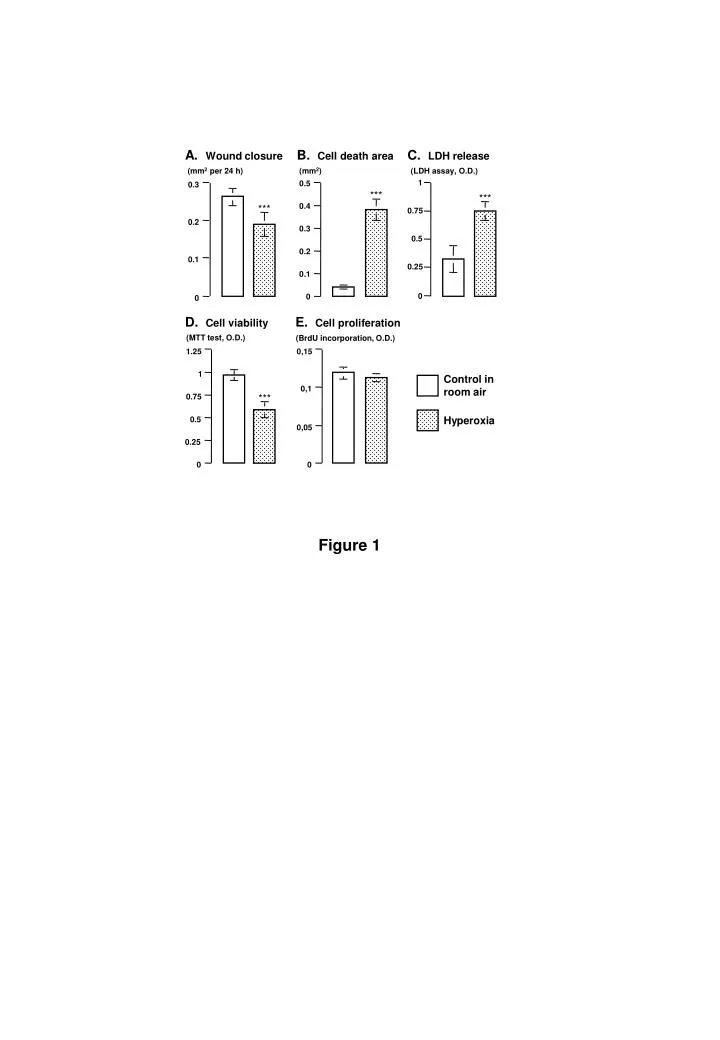
A. Wound closure. B. Cell death area. C. LDH release. (mm 2 per 24 h). (mm 2 ). (LDH assay, O.D.). 1. 0.5. 0.3. ***. ***. ***. 0.4. 0.75. 0.2. 0.3. 0.5. 0.2. 0.1. 0.25. 0.1. 0. 0. 0. D. Cell viability. E. Cell proliferation. (MTT test, O.D.).

E N D
A. Wound closure B. Cell death area C. LDH release (mm2 per 24 h) (mm2) (LDH assay, O.D.) 1 0.5 0.3 *** *** *** 0.4 0.75 0.2 0.3 0.5 0.2 0.1 0.25 0.1 0 0 0 D. Cell viability E. Cell proliferation (MTT test, O.D.) (BrdU incorporation, O.D.) 1.25 0,15 1 Control in room air 0,1 *** 0.75 Hyperoxia 0.5 0,05 0.25 0 0 Figure 1
A. Wound closure B. Cell death area C. LDH release + 180 1100 350 *** *** *** *** *** + 1000 160 300 900 140 800 250 120 700 200 100 600 * 500 80 150 400 60 * 100 +++ 300 40 200 50 20 100 0 0 0 D. Cell viability E. Cell proliferation 125 120 + 100 Control in room air 100 *** 80 Hyperoxia 75 60 Hyperoxia + KGF 10ng/ml 50 40 Hyperoxia + KGF 100ng/ml 25 20 0 0 Figure 2
Survival rate 1 0.8 0.6 0.4 0.2 0 0 2 4 6 8 10 Time (days) Figure 3
Cells in BAL (x 10-4 / ml) 22.5 20 17.5 ** 15 12.5 10 7.5 5 2.5 0 Control KGF Control KGF Room air Hyperoxia Figure 4
DNA content (µg / mg ww) *** 8 *** 7 6 5 4 3 2 1 0 Hyperoxia Room air Figure 5
C B A D 100 µm Figure 6
Caspase-3 protein 35kDa 19kDa 17kDa Ponceau S % of day 5 room-air control 120 100 *** 80 § 60 40 *** 20 0 room air hyperoxia room air hyperoxia day 10 day 5 Figure 7