Download
1 / 139
1.39k likes | 1.56k Vues
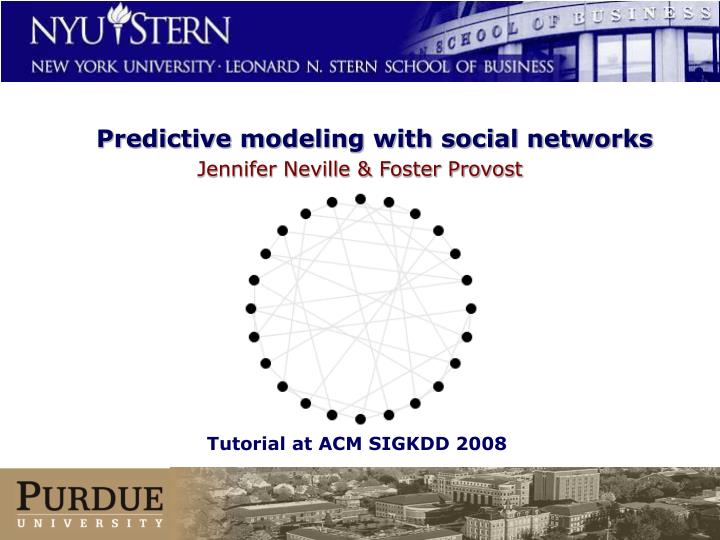
Predictive modeling with social networks. Jennifer Neville & Foster Provost. Tutorial at ACM SIGKDD 2008. Tutorial AAAI 2008. Social network data is everywhere. Call networks Email networks Movie networks Coauthor networks Affiliation networks Friendship networks

E N D
Predictive modeling with social networks Jennifer Neville & Foster Provost Tutorial at ACM SIGKDD 2008 Tutorial AAAI 2008
Social network data is everywhere • Call networks • Email networks • Movie networks • Coauthor networks • Affiliation networks • Friendship networks • Organizational networks http://images.businessweek.com/ss/06/09/ceo_socnet/source/1.htm
“…eMarketer projects that worldwide online social network ad spending will grow from $1.2 billion in 2007 to $2.2 billion in 2008, 82%.”
Modeling network data our focus today • Descriptive modeling • Social network analysis • Group/community detection • Predictive modeling • Link prediction • Attribute prediction
Goal of this tutorial • Our goal is not to give a comprehensive overview of relational learning algorithms (but we provide a long list of references and resources) • Our goal is to present • the main ideas that differentiate predictive inference and learning in (social) network data, • example techniques that embody these ideas, • results, from real applications if possible, and • references and resources where you can learn more In three hours (less the break) we cannot hope to be comprehensive in our coverage of theory, techniques, or applications. We will present the most important concepts, illustrate with example techniques and applications, and provide a long list of additional resources.
The problem: Attribute Prediction in Networked Data • To start, we’ll focus on the following inference problem: • For any node i, categorical variable yi, and value c, estimate p(yi = c|DK) DK is everything known about the network ? Macskassy & Provost (JMLR 2007) provide a broad treatment for univariate networks
Example:Network targeting (Hill et al. ‘06) • Define “Network Targeting” (NT) • cross between viral marketing and traditional targeted marketing • from simple to sophisticated… • construct variable(s) to represent whether the immediate network neighborhood contains existing customers • add social-network variables to targeting models, etc. (we’ll revisit) • then: • target individuals who are predicted (using the social network) to be the best prospects • simplest: target “network neighbors” of existing customers • this could expand “virally” through the network without any word-of-mouth advocacy, or could take advantage of it. • Example application: • Product: new communications service • Firm with long experience with targeted marketing • Sophisticated segmentation models based on data, experience, and intuition • e.g., demographic, geographic, loyalty data • e.g., intuition regarding the types of customers known or thought to have affinity for this type of service Hill, Provost, and Volinsky. “Network-based Marketing: Identifying likely adopters via consumer networks. ” Statistical Science 21 (2) 256–276, 2006.
Sales rates are substantially higher for network neighbors (Hill et al. ‘06) Relative Sales Rates for Marketing Segments (1.35%) (0.83%) (0.28%) (0.11%)
Firms increasingly are collecting data on explicit social networks of consumers
Other applications • Fraud detection • Targeted marketing • Bibliometrics • Firm/industry classification • Web-page classification • Epidemiology • Movie industry predictions • Personalization • Patent analysis • Law enforcement • Counterterrorism • …
Outline of the tutorial: part I • The basics • contemporary examples of social network inference in action • what’s different about network data? • basic analysis framework • (simple) predictive inference with univariate networks • disjoint inference • network linkage can provide substantial power for inference, if techniques can take advantage of relational autocorrelation • inductive inference (learning) in network data • disjoint learning – models learn correlation among attributes of labeled neighbors in the network Note on terminology: In this tutorial, we use the term “inference” to refer to the making of predictions for variables’ unknown values, typically using a model of some sort. We use “learning” to denote the building of the model from data (inductive inference). Generally we use the terminology common in statistical machine learning.Note on acronyms: see reference guide at end of tutorial
Outline of the tutorial: part II • Moving beyond the basics • collective inference • network structure alone can provide substantial power for inference, if techniques can propagate relational autocorrelation • inferred covariates can influence each other • collective learning • learning using both the labeled and unlabeled parts of the network, requires collective inference • social/data network vs. network of statistical dependencies • throughout: • example learning techniques • example inference techniques • example applications • Additional topics (time permitting) • methodology, evaluation, potential pathologies, understanding sources of error, other issues
Unique characteristics of networked data • Single data graph • Partially labeled • Widely varying link structure • Often heterogeneous object and link types • From learning perspective: graph contains both training data and application/testing data • Attribute dependencies • Homophily; autocorrelation among variables of linked entities • Correlation among attributes of linked entities • Correlations between attribute values and link structure Suggest key techniques: guilt-by-association relational learning collective inference
Relational autocorrelation – – – – – – – – – – – – – – – + – – – – + + + + + + + + + + – – – + – – – – – + + – – – + + + + + + – – + + – – + – – + – – • Correlation between the values of the same variable on related objects • Related instance pairs: • Dependence between pairs of values of X: High autocorrelation Low autocorrelation
How can we incorporate autocorrelation into predictive inference?
Disjoint inference (no learning) Use links to labeled nodes (i.e., guilt by association)
Is guilt-by-association justified theoretically? Thanks to (McPherson, et al., 2001) • Birds of a feather, flock together • – attributed to Robert Burton (1577-1640) • (People) love those who are like themselves • -- Aristotle, Rhetoric and Nichomachean Ethics • Similarity begets friendship • -- Plato, Phaedrus • Hanging out with a bad crowd will get you into trouble • -- Foster’s Mom
Is guilt-by-association justified theoretically? • Homophily • fundamental concept underlying social theories • (e.g., Blau 1977) • one of the first features noticed by analysts of social network structure • antecedents to SNA research from 1920’s (Freeman 1996) • fundamental basis for links of many types in social networks (McPherson, et al., Annu. Rev. Soc. 2001) • Patterns of homophily: • remarkably robust across widely varying types of relations • tend to get stronger as more relationships exist • Now being considered in mathematical analysis of networks (“assortativity”, e.g., Newman (2003)) • Does it apply to non-social networks?
Biology Functions of proteins located in together in cells (Neville & Jensen ‘02) Tuberculosis infection among people in close contact (Getoor et al ‘01) Business Industry categorization of corporations that share common boards members (Neville & Jensen ‘00) Industry categorization of corporations that co-occur in news stories (Bernstein et al ‘03) Citation analysis Topics of coreferent scientific papers (Taskar et al ‘01, Neville & Jensen ‘03) Marketing Product/service adoption among communicating customers (Domingos & Richardson ‘01, Hill et al ‘06) Fraud detection Fraud status of cellular customers who call common numbers (Fawcett & Provost ‘97, Cortes et al ‘01) Fraud status of brokers who work at the same branch (Neville & Jensen ‘05) Movies Box-office receipts of movies made by the same studio (Jensen & Neville ‘02) Web Topics of hyperlinked web pages (Chakrabarti et al ‘98, Taskar et al ‘02) Relational autocorrelation is ubiquitous
Disjoint inference Relative Sales Rates for Marketing Segments (1.35%) (0.83%) (0.28%) (0.11%) (Hill et al. ‘06)
Traditional learning and classification Non-relational classif. • Logistic regression • Neural networks • Naïve Bayes • Classification trees • SVMs • … yi yj xi xj home location, main calling location, min of use, … NYC,NYC,4350,3,5,yes,no,1,0,0,1,0,2,3,0,1,1,0,0,0,.. NYC,BOS,1320,2,no,no,1,0,0,0,0,1,5,1,7,6,7,0,0,1,… BOS,BOS,6543,5,no,no,0,1,1,1,0,0,0,0,0,0,4,3,0,4,.. ... … … • Methods:
Network learning and classification yi yj Relations xi xj • Methods: Non-relational classif. Network classification • Structural logistic regression • Relational naïve Bayes • Relational probability trees • Relational SVMs • … home location, main calling location, min of use, … NYC,NYC,4350,3,5,yes,no,1,0,0,1,0,2,3,0,1,1,0,0,0,.. NYC,BOS,1320,2,no,no,1,0,0,0,0,1,5,1,7,6,7,0,0,1,… BOS,BOS,6543,5,no,no,0,1,1,1,0,0,0,0,0,0,4,3,0,4,.. ... … …
Relational learning • Learning where data cannot be represented as a single relation/table of independently distributed entities, without losing important information • Data may be represented as: • a multi-table relational database, or • a heterogeneous, attributed graph, or • a first-order logic knowledge base • There is a huge literature on relational learning and it would be impossible to do justice to it in the short amount of time we have • For additional information, see: • Pointers/bibliography on tutorial page • International Conference on Inductive Logic Programming • Cussens & Kersting’s ICML’04 tutorial: Probabilistic Logic Learning • Getoor’s ICML’06/ECML’07 tutorials: Statistical Relational Learning • Domingos’s KDD’07/ICML’07 tutorials: Statistical Modeling of Relational Data • Literature review in Macskassy & Provost JMLR’07
Disjoint learning: part I Create (aggregate) features of labeled neighbors (Perlich & Provost KDD’03) treat aggregation and relational learning feature construction
Disjoint learning of relational models + + – – – + – – – + – – – – – – – + – + + – – – – + – + + + – – Y N – – – Y N Y N Create aggregate features of relational information Learn (adapted) flat model Consider local relational neighborhood around instances
Social network features can be created for “flat” models • where xG is a (vector of) network-based feature(s) • Example applications: • Fraud detection • construct variables representing connection to known fraudulent accounts (Fawcett & Provost ‘97) • or the similarity of immediate network to known fraudulent accounts (Cortes et al. ‘01; Hill et al. ‘06b) • Marketing(Hill et al. ’06a) • Creation of SN features can be (more or less) systematic: (Popescul & Ungar ’03; Perlich & Provost ’03,’06; Karamon et al. ’07,’08; Gallagher & Eliassi-Rad ‘08) • Compare with developing kernels for relational data (e.g., Gartner’03) • Also: Ideas from hypertext classification extend to SN modeling: • hypertext classification has text + graph structure • construct variables representing (aggregations of) the classes of linked pages/documents (Chakrabarti et al. ‘98; Lu & Getoor ‘03) • formulate as regularization/kernel combination (e.g., Zhang et al. KDD’06) • General survey of web page classification: (Qi & Davison, 2008)
ExampleStructural logistic regression(Popescul et al. ‘03) • Features • Based on boolean first-order logic features used in inductive logic programming • Top-down search of refinement graph • Includes additional database aggregators that result in scalar values (e.g. count, max) • Model • Logistic regression • Two-phase feature selection process with AIC/BIC
ExampleRelational probability trees(Neville et al. ‘03) • Features • Uses set of aggregators to construct features (e.g., Size, Average, Count, Proportion) • Exhaustive search within a user-defined space (e.g., <3 links away) • Model • Decision trees with probability estimates at leaves • Pre-pruning based on chi-square feature scores • Randomization tests for accurate feature selection (more on this later)
Learning patterns of labeled nodes • Features can be constructed that represent “guilt” of a node’s neighbors: • where xG is a (vector of) network-based feature(s) • Example application: • Marketing(Hill et al. ’06a)
Lift in sales with network-based features traditional variables traditional + network
Similar results for predicting customer attrition/churn Thanks to KXEN see also (Dasgupta et al. EDBT’08) & (Birke ’08) on social networks & telecom churn
Similar results for predicting customer attrition Thanks to KXEN
Disjoint learning: part II • Use node identifiers in features connections to specific individuals can be telling
challenge: aggregation over 1-to-n relationships Side note: not just for “networked data” – IDs are important for any data in a multi-table RDB
Towards a theory of aggregation (Perlich & Provost MLJ’06): A (recursive) Bayesian perspective • Traditional (naïve) Bayesian Classification: • P(c|X)=P(X|c)*P(c)/P(X) Bayes’ Rule • P(X|c)= P(xi|c) Assuming conditional independence • P(xi|c) & P(c) Estimated from the training data • Linked Data: xi might be an object identifier (e.g. SSN) => P(xi|c) cannot be estimated Let WI be a set of k objects linked to xi => P(xi|c) ~ P(linked-to-Wi|c) P(Wi|c) ~ P(O|c) Assume O is drawn independently P(Wi|c) ~ ( P(oj |c)) Assuming conditional independence
How to incorporate identifiers of related objects (in a nutshell) • Estimate from known data: • class-conditional distributions of related identifiers (say D+ & D-) • can be done, for example, assuming class-conditional independence in analogy to Naïve Bayes • save these as “meta-data” for use with particular cases • Any particular case C has its own “distribution” of related identifiers (say Dc) • Create features • d(Dc,D+ ), d(Dc, D- ), (d(Dc, D+ ) – d(Dc, D-)) • where d is a distance metric between distributions • Add these features to target-node description(s) for learning/estimation • Main idea: • “Is the distribution of nodes to which this case is linked • similar to that of a <whatever>?”
Density estimation for aggregation 1: Class-conditional distributions 2: Case linkage distributions: ? 4: Extended feature vector: 3: L2 distances for C1: L2(C1, DClass 1) = 1.125 L2(C1, DClass 0) = 0.08
A snippet from an actual network including “bad guys” Dialed-digit detector (Fawcett & P., 1997) Communities of Interest (Cortes et al. 2001) • nodes are people • links are communications • red nodes are fraudsters these two bad guys are well connected