Download
1 / 13
140 likes | 273 Vues
Factors Impacting Bay and Watershed Health. Pollutants. Nitrogen Loads and River Flow to the Bay. Nitrogen Loads and River Flow to Chesapeake Bay. Millions of Pounds of Nitrogen. Billions of Gallons of Flow. River Flow. Average Load.

E N D
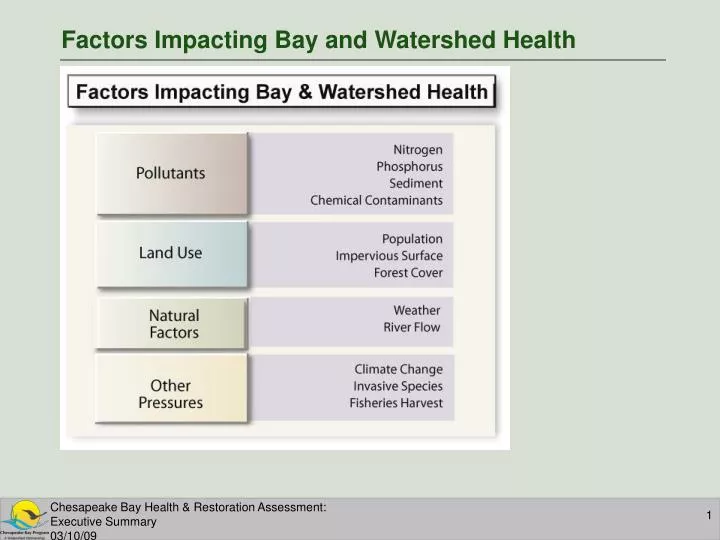
Factors Impacting Bay and Watershed Health Chesapeake Bay Health & Restoration Assessment: Executive Summary 03/10/09
Pollutants Chesapeake Bay Health & Restoration Assessment: Executive Summary 03/10/09
Nitrogen Loads and River Flow to the Bay Nitrogen Loads and River Flow to Chesapeake Bay Millions of Pounds of Nitrogen Billions of Gallons of Flow River Flow Average Load Data and Methods: www.chesapeakebay.net/status_nitrogen.aspx. 2008 data are provisional. Chesapeake Bay Health & Restoration Assessment: Executive Summary 03/10/09
Phosphorus Loads and River Flow to the Bay Phosphorus Loads and River Flow to Chesapeake Bay Millions of Pounds of Phosphorus Billions of Gallons of Flow River Flow Average Load Data and Methods: www.chesapeakebay.net/status_phosphorus.aspx. 2008 data are provisional. Chesapeake Bay Health & Restoration Assessment: Executive Summary 03/10/09
Sediment Loads and River Flow to the Bay • Preliminary estimates indicate that 3.3 million tons of sediment reached the Bay during 2008. This is 700,000 tons more than 2007 and 800,000 tons less than the 4.1 million ton average load from 1990-2008. • The sediment load estimates do not account for sediment from the coastal plain areas of the watershed. • Scientists are currently developing methods to quantify the total loads of sediment to the Bay. Chesapeake Bay Health & Restoration Assessment: Executive Summary 03/10/09
Chemical Contaminant Loads to the Bay • Synthetic organic pesticides and their degradation products have been widely detected at low levels in the watershed, including emerging contaminants such as pharmaceuticals and hormones. • Fish (principally male bass) in the Potomac watershed have testicular oocytes - female eggs growing in their testes - a form of intersex. Reproductive abnormalities in fish have been strongly linked with a variety of contaminants that affect the endocrine systems of fish. • Scientists are currently developing methods to quantify chemical contaminant loads to the Bay. Chesapeake Bay Health & Restoration Assessment: Executive Summary 03/10/09
Land Use Chesapeake Bay Health & Restoration Assessment: Executive Summary 03/10/09
Bay Watershed Population and Impervious Surface Bay Watershed Population and Impervious Surface Millions of Acres of Impervious Surface Millions of People Population Impervious Surface Projection Data and Methods: www.chesapeakebay.net/status_population.aspx Chesapeake Bay Health & Restoration Assessment: Executive Summary 03/10/09
Bay Watershed Forest Cover Bay Watershed Forest Cover Percent Forest Cover Data and Methods: www.chesapeakebay.net/status_watershedforests.aspx Chesapeake Bay Health & Restoration Assessment: Executive Summary 03/10/09
Natural Factors Chesapeake Bay Health & Restoration Assessment: Executive Summary 03/10/09
River Flow into Chesapeake Bay Water Year Mean River Flow (billions of gallons per day) Wet Years Normal Range Dry Years Data and Methods: www.chesapeakebay.net/status_riverflow.aspx Chesapeake Bay Health & Restoration Assessment: Executive Summary 03/10/09
Weather • Rainfall, temperature and winds have a great impact on water quality, habitats and fish and shellfish populations. • Climate change and variability have caused water temperatures in the Bay to exhibit greater extremes during the 20th century than the previous 2,000 years. • Sea-level rise related to climate change is contributing to the loss of vital coastal wetlands. Chesapeake Bay Health & Restoration Assessment: Executive Summary 03/10/09
Other Pressures Chesapeake Bay Health & Restoration Assessment: Executive Summary 03/10/09